This is most complex thread what I read there in ff. I dont understand anything that you talking about
- #42
- Mar 23, 2021 5:57pm Mar 23, 2021 5:57pm
- Joined May 2010 | Status: Straight line Fest | 3,197 Posts
- #45
- Mar 24, 2021 1:44am Mar 24, 2021 1:44am
- | Joined Apr 2017 | Status: 38737526 / 29052019 | 1,245 Posts
Market is not random but unpredictable
- #46
- Mar 24, 2021 5:15am Mar 24, 2021 5:15am
- Joined Sep 2015 | Status: Trader | 2,517 Posts
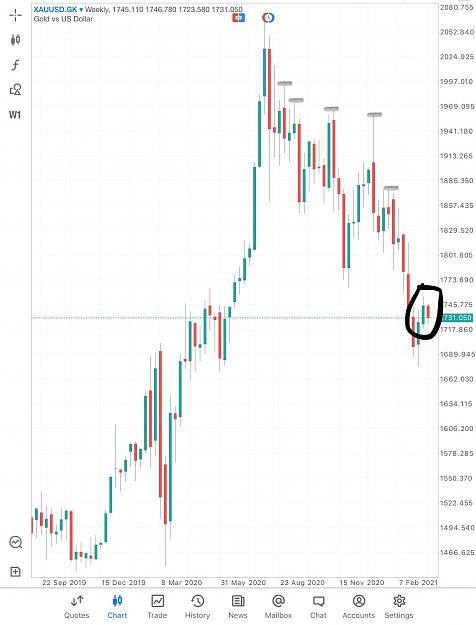
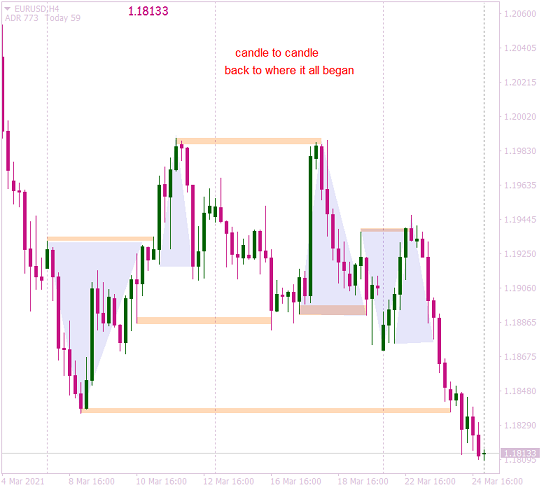
Trading thin liquidity at the boundary of the charts
- #47
- Mar 24, 2021 5:35am Mar 24, 2021 5:35am
- | Joined Apr 2017 | Status: 38737526 / 29052019 | 1,245 Posts
Market is not random but unpredictable
- #48
- Edited 3:49pm Mar 24, 2021 3:35pm | Edited 3:49pm
- Joined Sep 2015 | Status: Trader | 2,517 Posts
Trading thin liquidity at the boundary of the charts
- #49
- Edited 7:34pm Mar 24, 2021 7:19pm | Edited 7:34pm
- Joined Dec 2018 | Status: Trader | 4,616 Posts
- #50
- Mar 24, 2021 11:50pm Mar 24, 2021 11:50pm
- Joined Sep 2015 | Status: Trader | 2,517 Posts
Trading thin liquidity at the boundary of the charts
- #54
- Mar 25, 2021 8:14am Mar 25, 2021 8:14am
- Joined Sep 2015 | Status: Trader | 2,517 Posts
Trading thin liquidity at the boundary of the charts
- #55
- Mar 25, 2021 9:19am Mar 25, 2021 9:19am
- Joined Sep 2015 | Status: Trader | 2,517 Posts
Trading thin liquidity at the boundary of the charts
- #57
- Edited 4:19pm Mar 25, 2021 1:00pm | Edited 4:19pm
- Joined Jan 2020 | Status: Membership revoke | 2,332 Posts
Know what you trade
- #58
- Mar 25, 2021 1:38pm Mar 25, 2021 1:38pm
- | Joined Feb 2008 | Status: Suffering from Casandra syndrome | 1,384 Posts
- #59
- Mar 25, 2021 1:41pm Mar 25, 2021 1:41pm
- Joined Jan 2020 | Status: Membership revoke | 2,332 Posts
Know what you trade
- #60
- Mar 25, 2021 6:25pm Mar 25, 2021 6:25pm
- | Joined Apr 2017 | Status: 38737526 / 29052019 | 1,245 Posts
Market is not random but unpredictable