• Home
  • Forums
  • Trades
  • News
  • Calendar
  • Market
  • Brokers
  • Login
  • Join
  • User/Email: Password:
  • 3:27pm
Menu
  • Forums
  • Trades
  • News
  • Calendar
  • Market
  • Brokers
  • Login
  • Join
  • 3:27pm
Sister Sites
  • Metals Mine
  • Energy EXCH
  • Crypto Craft

Options

Bookmark Thread

First Page First Unread Last Page Last Post

Print Thread

Similar Threads

Building an equity millipede 7,431 replies

Flying Buddha Trading Idea 36 replies

A Flying Buddha does this work? 57 replies

Equity millipede & Flying Buddha trading journal 9 replies

Flying buddha pattern 12 replies

  • Trading Journals
  • /
  • Reply to Thread
  • Subscribe
  • 59
Attachments: Build an Equity Millipede with the filtered Flying Buddha
Exit Attachments
Tags: Build an Equity Millipede with the filtered Flying Buddha
Cancel

Build an Equity Millipede with the filtered Flying Buddha

  • Last Post
  •  
  • Page 1 23456 9
  • Page 1 234 9
  •  
  • Post #1
  • Quote
  • First Post: Jan 28, 2012 5:18pm Jan 28, 2012 5:18pm
  •  spyderman
  • Joined Nov 2010 | Status: Snaggin' Some Pips | 2,157 Posts
Okay boys and girls, welcome to my new journal thread. The purpose of this thread is to chronicle the progress of a new strategy that I’m employing and to give back to the FF community from which I have gained much.

This is a manual strategy that I personally trade on the Daily and H4 time frames, however it can be scaled to others as well.

This strategy combines elements from the “Building an Equity Millipede” thread located here: http://www.forexfactory.com/showthread.php?t=245149

It’s a great read and an awesome thread, but if many of you are like me you may have found it difficult to implement. I think I may have found the system to accomplish that. It’s certainly not my own invention, in fact it is roughly outlined within the pages of the “Millipede” thread. However, as is typically the case with most systems we all use, I have tweaked it and modified it to work for me.

Some of the elements incorporated were gleaned from discussions over at stevehopwoodforex.com. Some great EA coding going on over there.

The goal is to have an short to intermediate return while preserving many positions for “unlimited” growth.

You don’t have to understand the “Millipede” concept to use this method, but it will help, and some of the points we discuss will only make sense if you understand the principles contained therein. For those who don’t want to consume that whole thread (it is quite lengthy) I have included a zip file of all of Graeme’s (the thread OP) posts.

The Strategy:
My method employs a filtered “Flying Buddha” technique. The basic methodology of the “Flying Buddha” is discussed in the attached document and is a must read to understand this strategy.

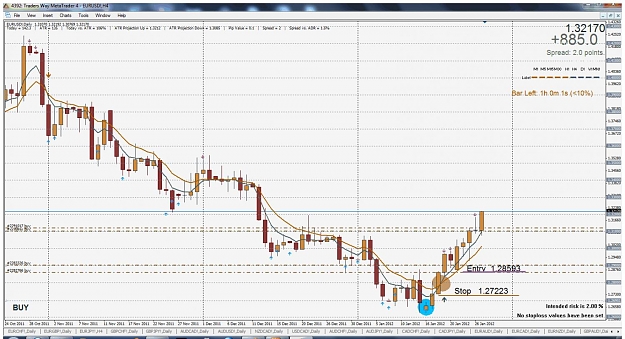
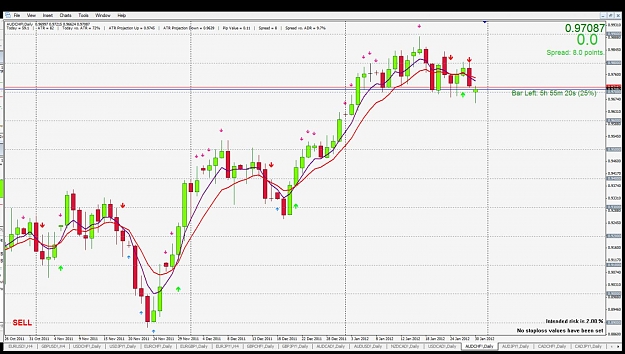
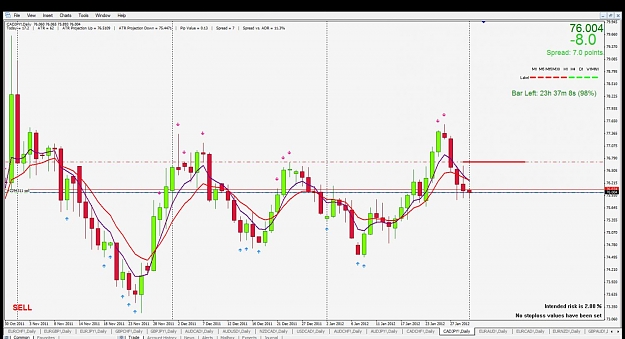
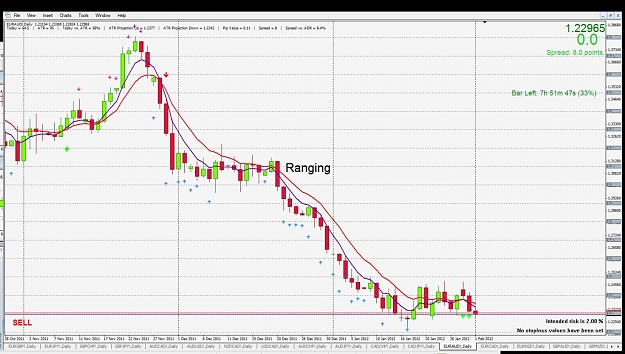
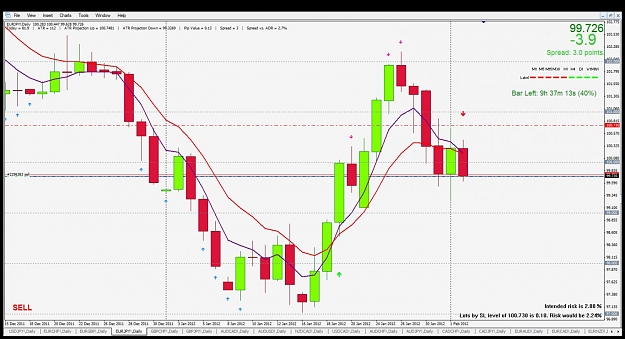
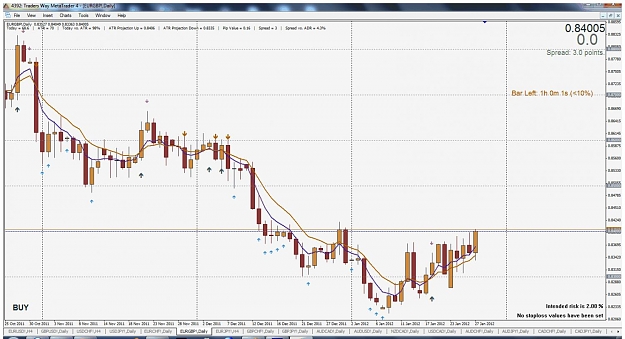
We’re not using a whole lot of indicators here. I’ve attached a template with my configuration as shown below. Many of the indicators are there for trade monitoring purposes and not necessary to the strategy itself. Use them if you want, delete them if you don’t.

The two main indicators are as follows:

Flying Buddha signals.
MA ribbon alerts set to a 5 and 10 MA

These two indicators help to filter one another.

The Setup:
The setup is run on a daily chart. I’m using the daily in this system because it’s easier for me to monitor. My daily bar starts at 4:00 pm local time so it’s a good time for me to watch for the new bars formation. I then stack on trades on the daily and H4.

We look for the “Flying Buddha” signal indicator to give us just that, an FB signal. As you read the attached file you will understand exactly what these are and why they can prove important.

We are not, however, trading on every flying Buddha, as they occur quite often and are not always…or even usually…an indication in a change of direction. Rather, we use the 5/10 MA crossover indicator to “confirm” the FB. Both of these indicators can be set up to give audible/visible signals when they are triggered.

So when we get a cross of the MA’s soon after a FB signal we have the setup for a trade. As we proceed you shall see that there is still some discretion as to entries. Looking at price action or perhaps current spreads I may not take every setup, but we’ll get to that as we go.

Lot Sizes:
Lot sizes, as always, are important. The attached template contains a nice lot size calculating tool. Based on our initial entry and s/l, along with our desired risk, we can set the lot size accordingly. I will then use that lot size throughout the “series” as I stack additional trades.

Stacking:
The stacking of trades are handled just like discussed in the attached pdf. Read it, and understand it, and then ask questions.

Trade exits:
Same as above.


Thread guidelines:
This is an open discussion, however I want to keep it on track with the original direction. We can discuss tweaks, but let’s keep on track. Be nice...or be gone.


Well that’s about it for now. We’ll see how this goes and what kind of legs it has.
Attached Image (click to enlarge)
Click to Enlarge

Name: fb.jpg
Size: 135 KB
Attached File(s)
File Type: pdf Flying Buddha trading system-1.pdf   183 KB | 6,814 downloads
File Type: zip Graeme Posts Only.zip   657 KB | 2,087 downloads
File Type: zip indicators.zip   44 KB | 2,012 downloads
File Type: tpl # fb.tpl   55 KB | 1,425 downloads
  • Post #2
  • Quote
  • Jan 29, 2012 9:46am Jan 29, 2012 9:46am
  •  spyderman
  • Joined Nov 2010 | Status: Snaggin' Some Pips | 2,157 Posts
Okay, now that we've had a bit of time to assimilate the attachments lets overview the trade.

We'll take a short trade as our example but of course everything applies to a long trade but in reverse.

The chart below show our indicators at work. The blue and magenta arrows are flying buddhas. You can see why we don't take all these as trades. There's just too many. The green and red arrows are the crosses of the MA.

In the blue circle we see a set up FB and a few bars later its confirmed by the MA cross. Looking at price action this appears to be a nice trade so we enter at the cross, if we catch it, or at the open of the next bar and set our stop to a few pips below the low of the previous bar.

As the trade progress we move our stop to BE + a couple of pips. I usually wait until I have some room on the trade before setting to BE...maybe 25 pips or so. There are worse things then having your trade exit at BE.

Once that trade is at BE you can begin to look for opportunities to stack trades as outlined in the attached text. We take these trades at the 50% fib of each successive bar. If price opens above the 50% fib of the previous bar we place a limit order at the 50 with the stop a few pips below the low.

If price opens below the 50 we can place a stop order at 50 with the same s/l or if we have room we can enter at market for a discount and keep the same s/l. Check the price action.

We also zoom down to the H4 tf and follow the same procedure there. This gives us opportunities to really stack trades.

_________________________

You have to be a little patient with this technique, especially out of the gate. Price action is going to take out some of your orders. Many at BE, but a few at the relatively small s/l that you have set. The idea is once you get rolling the large potential profits will way more then offset the small losses.
Attached Image (click to enlarge)
Click to Enlarge

Name: fb entry.jpg
Size: 177 KB
 
 
  • Post #3
  • Quote
  • Jan 30, 2012 10:47am Jan 30, 2012 10:47am
  •  Aimak
  • | Joined Nov 2009 | Status: Salud y Conocimiento. | 96 Posts
Nice to see an implementation of Graeme´s lessons.

I have two questions:
1. From the closed trades there are several with negative results. Were these resulted from false FB? Or are not related to the thread method?

2. Are you using SL? We can see three trades with negative pips. Why did you not set the SL at BE yesterday when they were positive?

Thanks in advance. You got me watching this thread now. I will post my results as soon as I have something interesting.

Best luck.

Aimak
 
 
  • Post #4
  • Quote
  • Jan 30, 2012 11:06am Jan 30, 2012 11:06am
  •  spyderman
  • Joined Nov 2010 | Status: Snaggin' Some Pips | 2,157 Posts
Quoting Aimak
Disliked
Nice to see an implementation of Graeme´s lessons.

I have two questions:
1. From the closed trades there are several with negative results. Were these resulted from false FB? Or are not related to the thread method?

2. Are you using SL? We can see three trades with negative pips. Why did you not set the SL at BE yesterday when they were positive?

Thanks in advance. You got me watching this thread now. I will post my results as soon as I have something interesting.

Best luck.

Aimak
Ignored
Aimak...good questions. Most of the older negative trades are from another strategy. I wanted to try this on a live account so used one I already had going. Having said that, Sunday night was tough on trading across the board. I had many of my orders hit...some at BE some at small loss. We will look to rebuild moving forward.

As to the 2nd question...As this is a manual method and I cannot be in front of the screen at all times, there will be times when s/l doesn't get moved to BE as soon as I would like. That's another reason I'm trading this on daily and H4. Imagine trying to watch trades on the hourly and lower.

Once I get a new signal for the start of a trade sequence I will post the charts accordingly. I think it will be much clearer and more helpful to see how the trades go in real time. We'll have to be patient and wait for the right entry.

As an example of when "not" to trade, here was a FB and subsequent cross on AUD/CHF that I did not take. Notice how price meanders along after the FB. Also the MA crosses were more sideways than vertical like we would like to see.
Attached Image (click to enlarge)
Click to Enlarge

Name: fb.jpg
Size: 147 KB
 
 
  • Post #5
  • Quote
  • Jan 30, 2012 12:58pm Jan 30, 2012 12:58pm
  •  Aimak
  • | Joined Nov 2009 | Status: Salud y Conocimiento. | 96 Posts
Quoting spyderman
Disliked
Aimak...good questions. Most of the older negative trades are from another strategy. I wanted to try this on a live account so used one I already had going. Having said that, Sunday night was tough on trading across the board. I had many of my orders hit...some at BE some at small loss. We will look to rebuild moving forward.

As to the 2nd question...As this is a manual method and I cannot be in front of the screen at all times, there will be times when s/l doesn't get moved to BE as soon as I would like. That's another reason I'm trading...
Ignored
Indeed Spyderman , the higher the timeframe the larger drawdown. Because of this I´m practising entries on M5 to minimise the drawdown, as Graeme recommended. Not an easy task either because of the time I have to spend in front of the computer.

I would like to find or create an EA for helping setting the SL to BE. I haven´t found one that can handle several trades in different directions. My programming skills are quite insufficient, but I got some time to learn and research how to do it.

Currently I would not dare to open a trade in favour of CHF as the SNB could intervene to weaken it any time, so the rumours say. Now, I prefer to short the AUDUSD because it shows a FB still developing in the daily and weekly charts. But you already know this

KR
Aimak
 
 
  • Post #6
  • Quote
  • Jan 30, 2012 1:45pm Jan 30, 2012 1:45pm
  •  spyderman
  • Joined Nov 2010 | Status: Snaggin' Some Pips | 2,157 Posts
Quoting Aimak
Disliked
Now, I prefer to short the AUDUSD because it shows a FB still developing in the daily and weekly charts. But you already know this

KR
Aimak
Ignored

Yes the A/U may be setting up nicely. Back to back FB's on the daily and price action is coming down. We'll see if we get a cross.

I've attached a great MM ea that has myriads of bells and whistles for managing a trade. Almost too many bells and whistles.
Attached File(s)
File Type: mq4 Multi purpose trade manager.mq4   28 KB | 852 downloads
File Type: pdf Multi purpose trade manager instructions.pdf   68 KB | 2,474 downloads
 
 
  • Post #7
  • Quote
  • Jan 30, 2012 6:08pm Jan 30, 2012 6:08pm
  •  bhupinder
  • | Joined Apr 2004 | Status: Member | 86 Posts
Hello spyderman,
Thanks for starting the thread.I was a follower of millipede thread but could not follow along,it was movind too fast.I will following you on this thread and try to learn the method with your help.Thanks again
 
 
  • Post #8
  • Quote
  • Jan 30, 2012 8:51pm Jan 30, 2012 8:51pm
  •  spyderman
  • Joined Nov 2010 | Status: Snaggin' Some Pips | 2,157 Posts
Quoting bhupinder
Disliked
Hello spyderman,
Thanks for starting the thread.I was a follower of millipede thread but could not follow along,it was movind too fast.I will following you on this thread and try to learn the method with your help.Thanks again
Ignored

Welcome bhup. Should be a fun ride
 
 
  • Post #9
  • Quote
  • Jan 31, 2012 9:38am Jan 31, 2012 9:38am
  •  screenname
  • | Joined Apr 2011 | Status: Member | 78 Posts
Hi Spyderman, thanks for starting the thread. I have a couple of quick questions:

1) You used 5/10 cross to confirm FB. Do you have a limit as to how many days you need to wait? Say if the crossover happens three days after FB, will you still take it?

2) Have you done any test to get an idea of the success rate of initial position of this filtered FB? I remember the original Joe trader's rate is 40%.

Thanks. I've subscribed your thread.

screen
 
 
  • Post #10
  • Quote
  • Jan 31, 2012 11:14am Jan 31, 2012 11:14am
  •  spyderman
  • Joined Nov 2010 | Status: Snaggin' Some Pips | 2,157 Posts
Quoting screenname
Disliked
Hi Spyderman, thanks for starting the thread. I have a couple of quick questions:

1) You used 5/10 cross to confirm FB. Do you have a limit as to how many days you need to wait? Say if the crossover happens three days after FB, will you still take it?

2) Have you done any test to get an idea of the success rate of initial position of this filtered FB? I remember the original Joe trader's rate is 40%.

Thanks. I've subscribed your thread.

screen
Ignored
Screename,

Welcome...excellent questions. I figured someone would ask #1 fairly soon.

The answer, quite frankly, is it depends. There is no set time limit. I look to price action as mentioned earlier. I don't want to see price meander sideways for several days after the FB and then cross. The longer it does the more the psychology that generated the FB fades.

So having said that, usually we'll look for the cross within 2 or 3 bars after the FB.

As to the second question, it depends to some degree what we classify as "success". If we're talking about moving the initial order to BE then I would say around 75%. Now that doesn't mean that we won't lose pips later due to our stacking trades stopping out. Time will only tell on those.

If we measure our success on overall profitability of the trade series, which seems reasonable to me, then we won't be able to measure our success until we begin in close out trades as per the exit strategy outlined in the PDF docs.
 
 
  • Post #11
  • Quote
  • Jan 31, 2012 5:27pm Jan 31, 2012 5:27pm
  •  spyderman
  • Joined Nov 2010 | Status: Snaggin' Some Pips | 2,157 Posts
Okay everyone. We have a trade initiated.

We have a cross to the down side on CAD/JPY on the daily preceded a few bars back by consecutive FB's. Price action is coming down nicely so we're going to enter short at 75.994 with a s/l of 76.710.

We'll watch and see how she progresses.
Attached Image (click to enlarge)
Click to Enlarge

Name: fb.jpg
Size: 125 KB
 
 
  • Post #12
  • Quote
  • Feb 1, 2012 6:48am Feb 1, 2012 6:48am
  •  miekra
  • | Joined Feb 2010 | Status: Member | 48 Posts
I've attached a great MM ea that has myriads of bells and whistles for managing a trade. Almost too many bells and whistles.[/quote]

Hi Spyderman,

Description of Multi-purpose Trade Manager mention "Put 'Remove stop losses' in the Scripts folder"

Pls attach "Remove stop losses" as this file is missing.

May green pips be with you!

Kind Regards
miekra
 
 
  • Post #13
  • Quote
  • Feb 1, 2012 7:33am Feb 1, 2012 7:33am
  •  spyderman
  • Joined Nov 2010 | Status: Snaggin' Some Pips | 2,157 Posts
Quoting miekra
Disliked

Hi Spyderman,

Description of Multi-purpose Trade Manager mention "Put 'Remove stop losses' in the Scripts folder"

Pls attach "Remove stop losses" as this file is missing.

May green pips be with you!

Kind Regards
miekra
Ignored
Miekral,

That's one of the "bells and whistles" on the EA that I don't use so I don't have that script in my newer versions of MT4. I'm sure you could find the script here on FF by doing a search, but again not necessary for the EA to function and monitor the trades.
 
 
  • Post #14
  • Quote
  • Feb 1, 2012 9:12am Feb 1, 2012 9:12am
  •  spyderman
  • Joined Nov 2010 | Status: Snaggin' Some Pips | 2,157 Posts
It's always hard coming into a new strategy on the higher TF's and waiting for the right setup. They just don't happen every day. But patience is the key here.

Attached is a very nice hindsight series on the Eur/Aud. You would have closed out many orders on the ranging portion but would have replaced those again on the way down.

Let's be patient
Attached Image (click to enlarge)
Click to Enlarge

Name: fb.jpg
Size: 159 KB
 
 
  • Post #15
  • Quote
  • Feb 2, 2012 7:25am Feb 2, 2012 7:25am
  •  spyderman
  • Joined Nov 2010 | Status: Snaggin' Some Pips | 2,157 Posts
We have a new series started on the Eur/Jpy. Just had a cross down so I've entered a sell at that point.
Attached Image (click to enlarge)
Click to Enlarge

Name: fb entry.jpg
Size: 134 KB
 
 
  • Post #16
  • Quote
  • Feb 3, 2012 8:34am Feb 3, 2012 8:34am
  •  virtue
  • | Joined Jul 2010 | Status: Member | 16 Posts
Hi Spyderman,

I have spent some time trading with flying buddhas. I never filtered them with a MA crossover like you're doing. I entered when the high/low of the flying buddha was exceeded. I'm interested to see how your method works out.

When I performed my research I found that the success rate wasn't brilliant but the rewards could be very large indeed. For example, I compiled the following stats for trading flying buddhas on the Daily chart for EURUSD from July 2009 to March 2011.

Trades - 41
Winners - 7 (17%, largest - 1,900 pips)
Losers - 9 (22%, largest - 145 pips)
Break even - 25

Total net profit of 5,120 pips.

I compiled stats for other pairs and other time frames but they weren't as impressive.

After compiling these stats I started to trade in real time with flying buddhas. I had mixed results but I found that they're great at identifying apexes in the market. I evolved to only trade a flying buddha if it has confluence with other factors, such as: support/resistance levels, fibo levels, previous high/lows etc. I found that this confluence raised the success rate.

I now no longer trade them exclusively but I still use them regularly in my analysis.


All the best with your trading. I will check back from time to time to see how your experiment is going.
 
 
  • Post #17
  • Quote
  • Feb 3, 2012 9:24am Feb 3, 2012 9:24am
  •  spyderman
  • Joined Nov 2010 | Status: Snaggin' Some Pips | 2,157 Posts
Both JPY crosses stopped out this morning...sigh...
Not a very auspicious start to the thread. Non-farm news is hitting a lot of trade strategy's this morning.

Not to worry...we may not have any more action today which is fine for Friday. We'll start up again at the first of the week.
 
 
  • Post #18
  • Quote
  • Feb 3, 2012 9:26am Feb 3, 2012 9:26am
  •  spyderman
  • Joined Nov 2010 | Status: Snaggin' Some Pips | 2,157 Posts
Quoting virtue
Disliked
Hi Spyderman,

I have spent some time trading with flying buddhas. I never filtered them with a MA crossover like you're doing. I entered when the high/low of the flying buddha was exceeded. I'm interested to see how your method works out.

When I performed my research I found that the success rate wasn't brilliant but the rewards could be very large indeed. For example, I compiled the following stats for trading flying buddhas on the Daily chart for EURUSD from July 2009 to March 2011.

Trades - 41
Winners - 7 (17%, largest - 1,900 pips)
Losers - 9 (22%, largest - 145 pips)
Break even - 25

Total net profit of 5,120 pips.

I compiled stats for other pairs and other time frames but they weren't as impressive.

After compiling these stats I started to trade in real time with flying buddhas. I had mixed results but I found that they're great at identifying apexes in the market. I evolved to only trade a flying buddha if it has confluence with other factors, such as: support/resistance levels, fibo levels, previous high/lows etc. I found that this confluence raised the success rate.

I now no longer trade them exclusively but I still use them regularly in my analysis.


All the best with your trading. I will check back from time to time to see how your experiment is going.


Ignored
Thanks Virtue for your input.

We'll see how she flies.
 
 
  • Post #19
  • Quote
  • Feb 4, 2012 4:43am Feb 4, 2012 4:43am
  •  maaj
  • | Joined Sep 2010 | Status: Member | 101 Posts
Hello Spyderman,

Thank for starting this thread. I am still following Graeme's thread which is one of the gems among all forex forums. I like the way you have modified Graeme's teaching to suit your need.

-HappyTrading-
-happyTrading, maaj-
 
 
  • Post #20
  • Quote
  • Feb 7, 2012 3:06pm Feb 7, 2012 3:06pm
  •  spyderman
  • Joined Nov 2010 | Status: Snaggin' Some Pips | 2,157 Posts
Still waiting for new signals to come out on the Daily. Lot's of activity on existing series, but we'll wait it out.
 
 
  • Trading Journals
  • /
  • Build an Equity Millipede with the filtered Flying Buddha
  • Reply to Thread
    • Page 1 23456 9
    • Page 1 234 9
0 traders viewing now
  • More
Top of Page
  • Facebook
  • Twitter
About FF
  • Mission
  • Products
  • User Guide
  • Media Kit
  • Blog
  • Contact
FF Products
  • Forums
  • Trades
  • Calendar
  • News
  • Market
  • Brokers
  • Trade Explorer
FF Website
  • Homepage
  • Search
  • Members
  • Report a Bug
Follow FF
  • Facebook
  • Twitter

FF Sister Sites:

  • Metals Mine
  • Energy EXCH
  • Crypto Craft

Forex Factory® is a brand of Fair Economy, Inc.

Terms of Service / ©2023