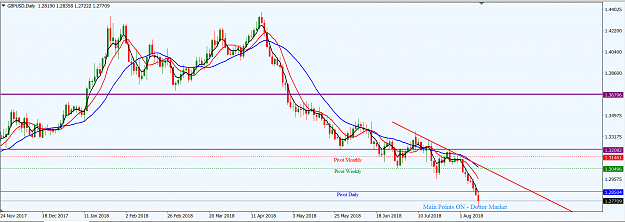
GBPUSD Weekly Technical Outlook
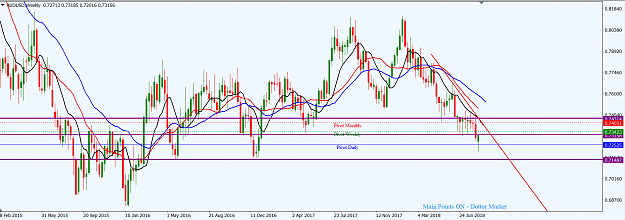
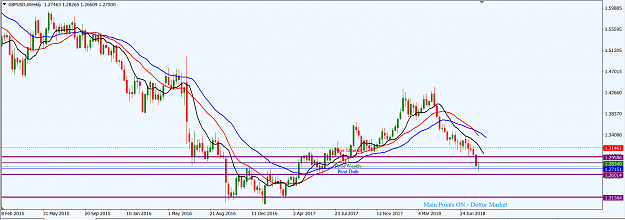
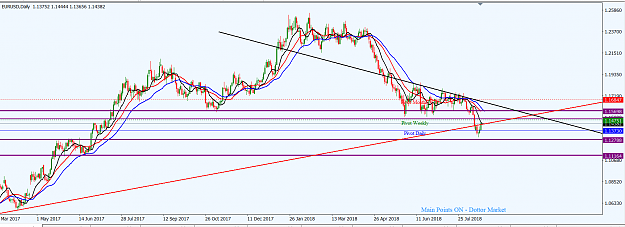
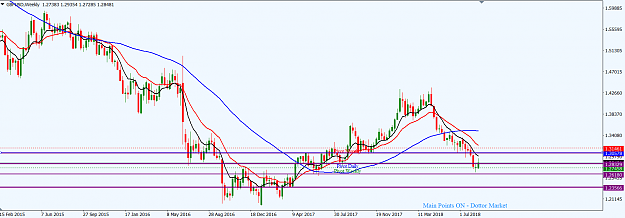
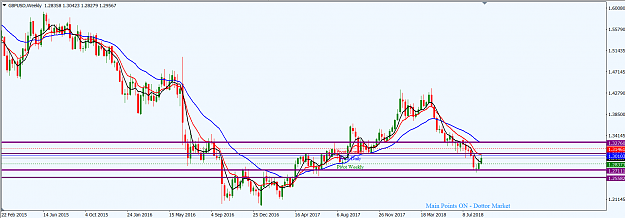
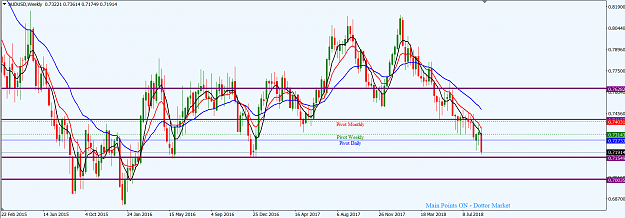
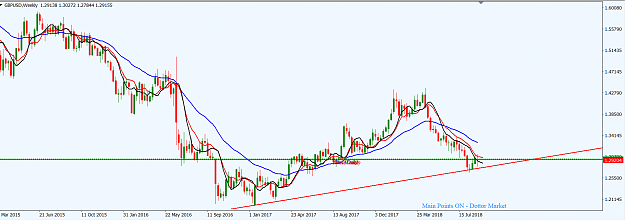
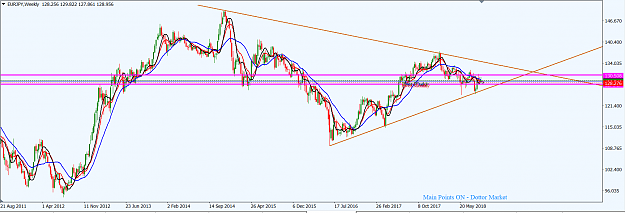
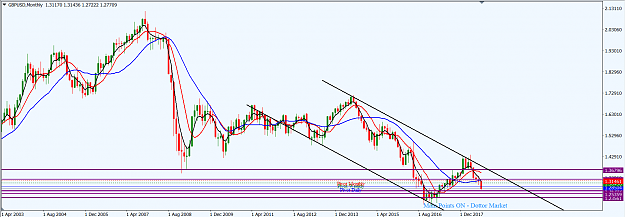
Price action on GBPUSD carved out a descending channel (black) on the monthly time frame. Three price waves have completed within the channel and a fourth, bearing southward, kicked in at channel resistance in April 2018. Presently, price action is operating below the monthly pivot and has entered a horizontal support around the 1.26650 area.
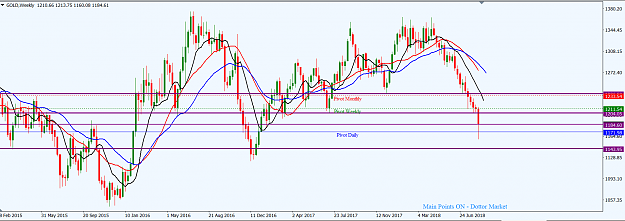
On the weekly time frame, recent price action has seen a series of consolidation since the end of April 2018. Last week, price action printed a bearish continuation candlestick which broke down a recent consolidation. It moved into a horizontal support zone around the 1.26790 area but bulls checkmated its southward momentum. We may see some sideways operation, or even a pullback, of price action in the early part of this week but the major market disposition is technically southward.
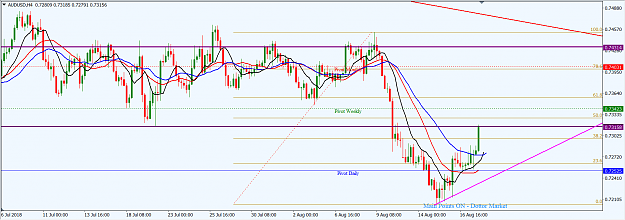
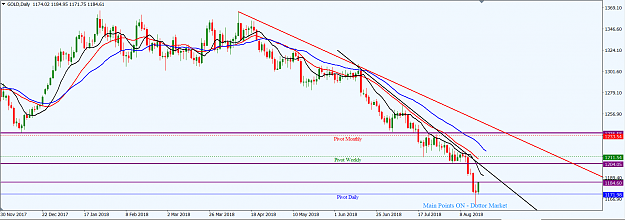
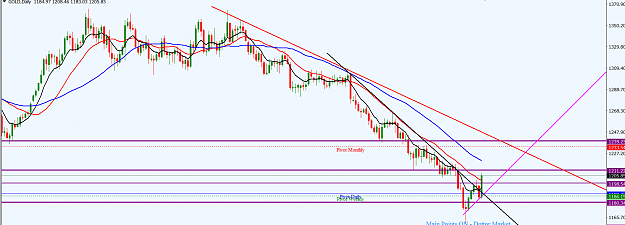
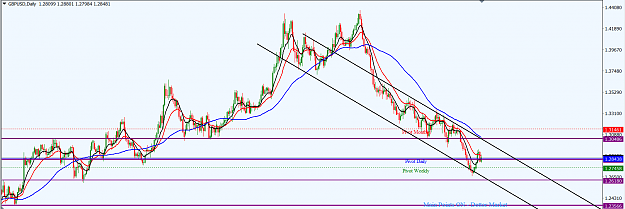
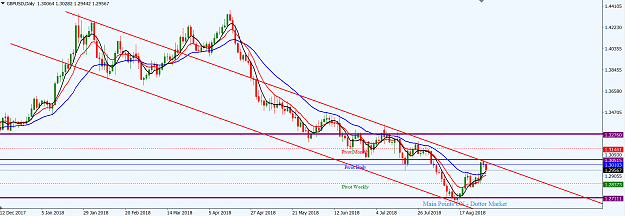
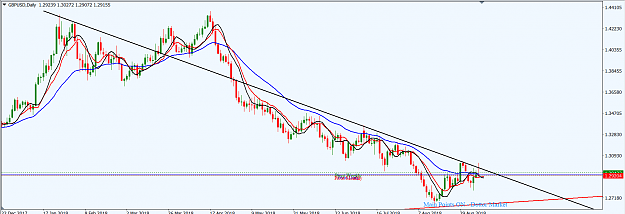
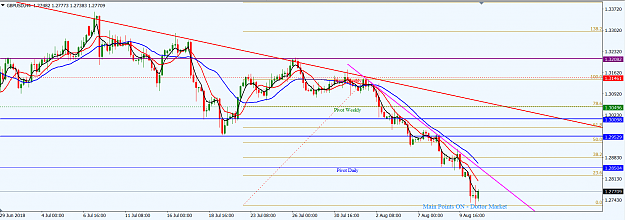
The daily time frame indicates that price action has moved strongly southward and apparently far from the mean value area. We may see a pullback of price action to the broken down horizontal support around the 1.30100 area. We should also be aware of a descending trendline (red) which may act as resistance.
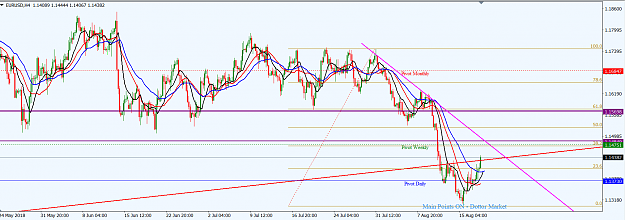
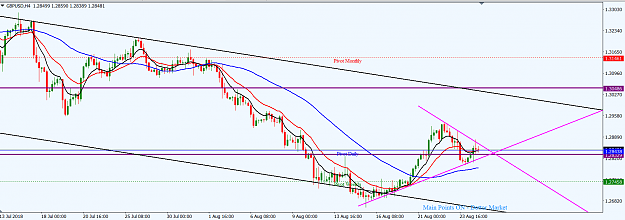
Price action on the H4 time frame has moved southward of an outer descending trendline (red) seen on the daily time frame and is respecting an inner descending trendline (magenta). This is an indication of an increase in momentum, which is likely to be corrected with a pullback to a broken down support area. Even though the most recent price action last week Friday saw bulls take the market a bit northward, it was in the context of a minor consolidation. However, there may still be a further northward pullback to an area of value; and there are many such areas on the H4 time frame. But the previous support around 1.30100 (i.e. 1.29530/1.30100), bound by horizontal blue lines, has a greater potential; it is a confluence of the 61.8 Fib retracement of the recent drop from the monthly pivot as well as being a round number area. At any rate, wherever market decides to turn around should be of interest knowing that technically the market favours the bears.
I may be wrong. Trade safe and prosper.
KP
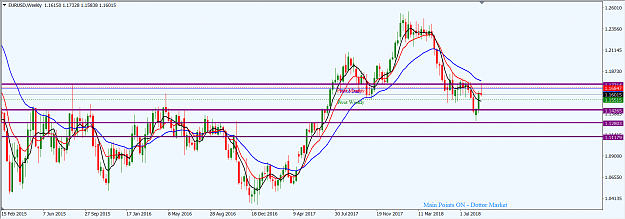
Price action on GBPUSD carved out a descending channel (black) on the monthly time frame. Three price waves have completed within the channel and a fourth, bearing southward, kicked in at channel resistance in April 2018. Presently, price action is operating below the monthly pivot and has entered a horizontal support around the 1.26650 area.
Attached Image (click to enlarge)
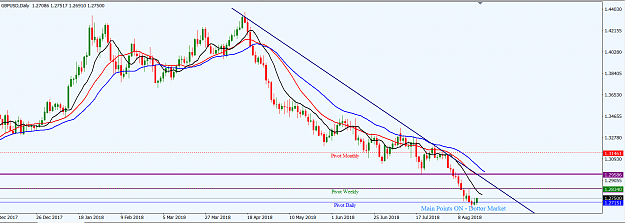
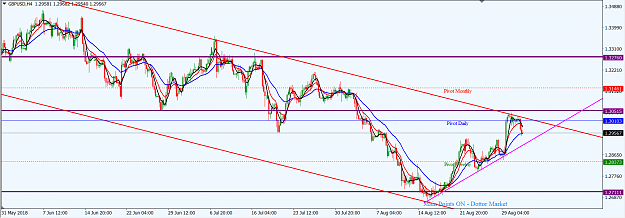
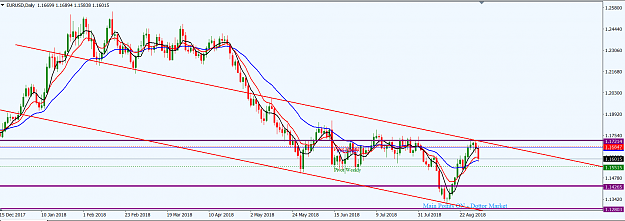
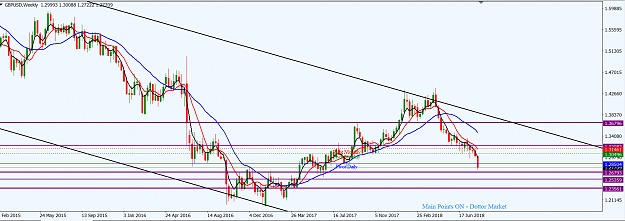
On the weekly time frame, recent price action has seen a series of consolidation since the end of April 2018. Last week, price action printed a bearish continuation candlestick which broke down a recent consolidation. It moved into a horizontal support zone around the 1.26790 area but bulls checkmated its southward momentum. We may see some sideways operation, or even a pullback, of price action in the early part of this week but the major market disposition is technically southward.
Attached Image (click to enlarge)
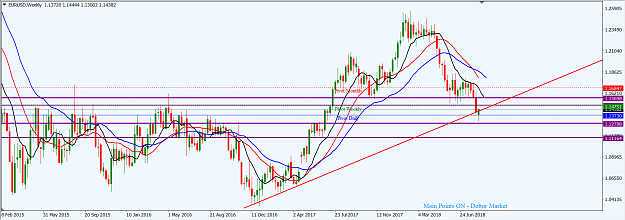
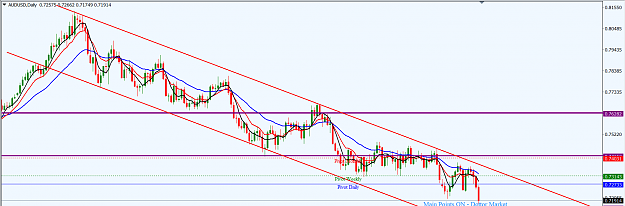
The daily time frame indicates that price action has moved strongly southward and apparently far from the mean value area. We may see a pullback of price action to the broken down horizontal support around the 1.30100 area. We should also be aware of a descending trendline (red) which may act as resistance.
Attached Image (click to enlarge)
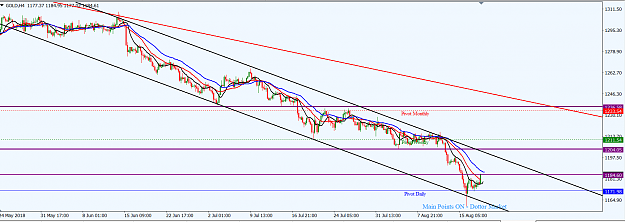
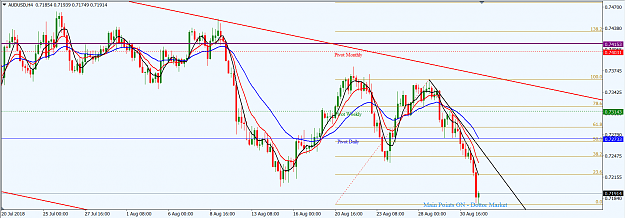
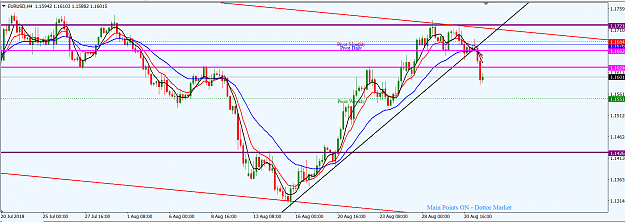
Price action on the H4 time frame has moved southward of an outer descending trendline (red) seen on the daily time frame and is respecting an inner descending trendline (magenta). This is an indication of an increase in momentum, which is likely to be corrected with a pullback to a broken down support area. Even though the most recent price action last week Friday saw bulls take the market a bit northward, it was in the context of a minor consolidation. However, there may still be a further northward pullback to an area of value; and there are many such areas on the H4 time frame. But the previous support around 1.30100 (i.e. 1.29530/1.30100), bound by horizontal blue lines, has a greater potential; it is a confluence of the 61.8 Fib retracement of the recent drop from the monthly pivot as well as being a round number area. At any rate, wherever market decides to turn around should be of interest knowing that technically the market favours the bears.
Attached Image (click to enlarge)
I may be wrong. Trade safe and prosper.
KP
Do your homework, follow the footprints of smart money