• Home
  • Forums
  • Trades
  • News
  • Calendar
  • Market
  • Brokers
  • Login
  • Join
  • User/Email: Password:
  • 8:59pm
Menu
  • Forums
  • Trades
  • News
  • Calendar
  • Market
  • Brokers
  • Login
  • Join
  • 8:59pm
Sister Sites
  • Metals Mine
  • Energy EXCH
  • Crypto Craft

Options

Bookmark Thread

First Page First Unread Last Page Last Post

Print Thread

Similar Threads

Weekly Top-Down Technical Analyses 1,669 replies

Major Pairs/Crosses - Trading Scenarios, Analyses & Forecasts 15 replies

Short Term / Medium Term / Long Term? 3 replies

USD/CAD - Loonie Toons, & mostly pointless analyses 2 replies

Lazy analyses thread 56 replies

  • Interactive Trading
  • /
  • Reply to Thread
  • Subscribe
  • 83
Attachments: Long Term Analyses - EURUSD, GOLD, and S&P
Exit Attachments
Tags: Long Term Analyses - EURUSD, GOLD, and S&P
Cancel

Long Term Analyses - EURUSD, GOLD, and S&P

  • Last Post
  •  
  • Page 1 23 4
  • Page 1 23 4
  •  
  • Post #1
  • Quote
  • First Post: Apr 6, 2014 4:45pm Apr 6, 2014 4:45pm
  •  enterfx
  • | Joined Nov 2009 | Status: The Trend is Your Friend | 1,123 Posts
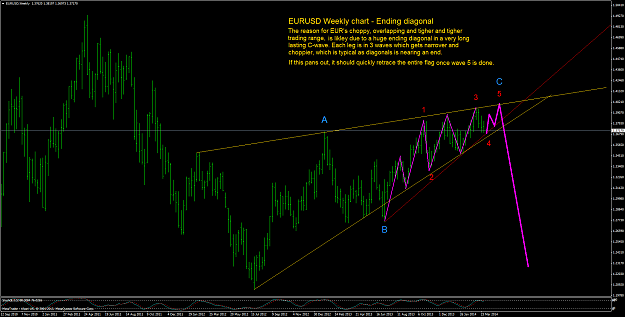
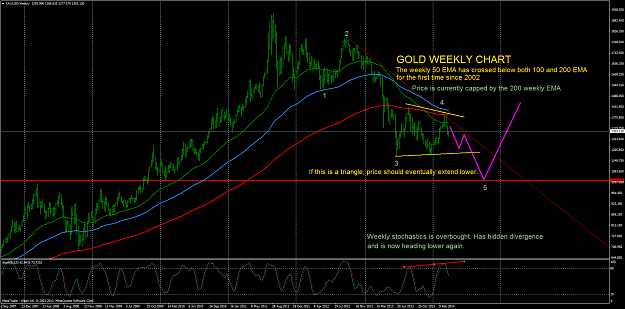
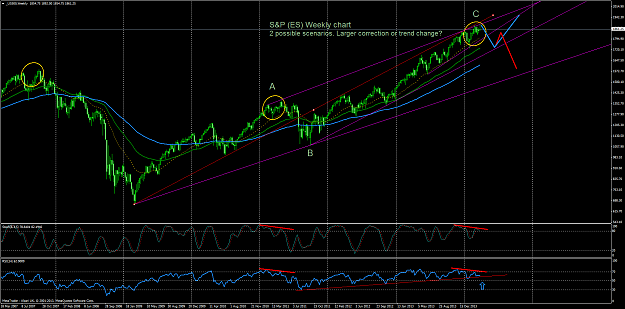
LONG TERM ANALYSES BY ENTERFX - EURUSD, GOLD and S&P:

I provide no trading calls, just unbiased long and mid term technical
analyses based on my own view and opinions. I also do this to learn more
and by that I can be held accountable for what's posted here oppose
to what the market actually does in the future.

As you know, it's a tough business and I don't know a single trader or analyst who
is right all the time. We can only predict, which is quite fascinating with this business.

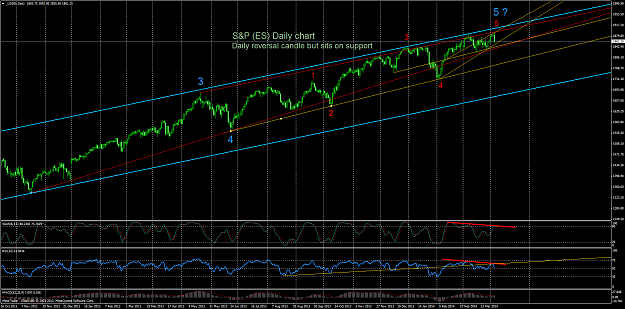
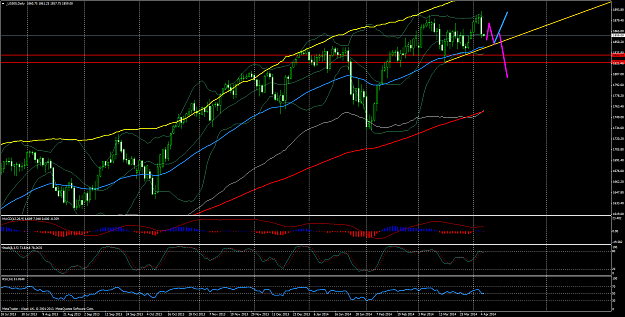
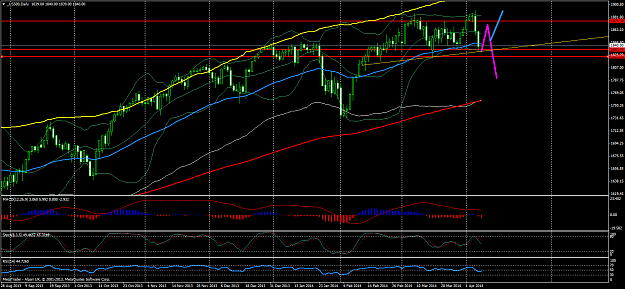
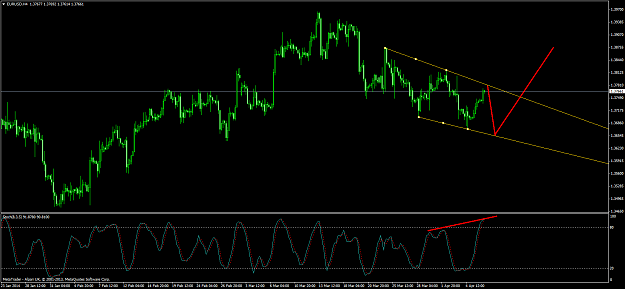
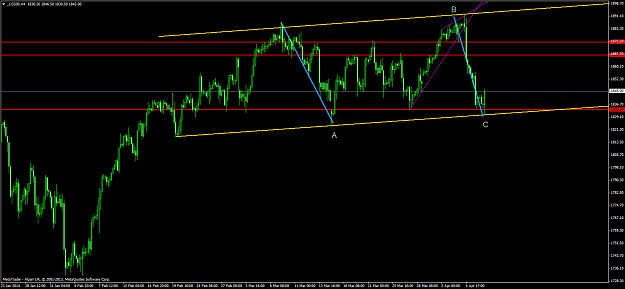
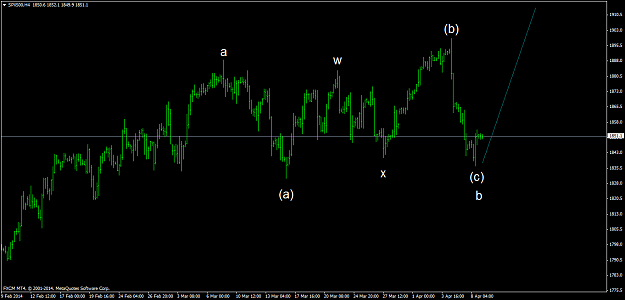
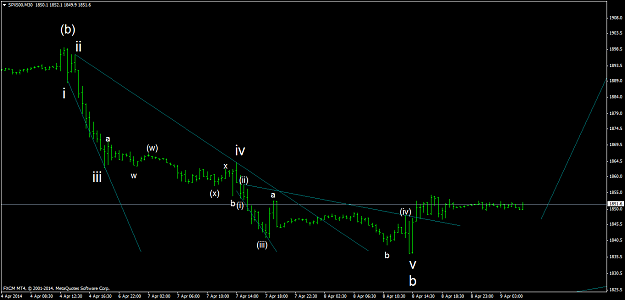
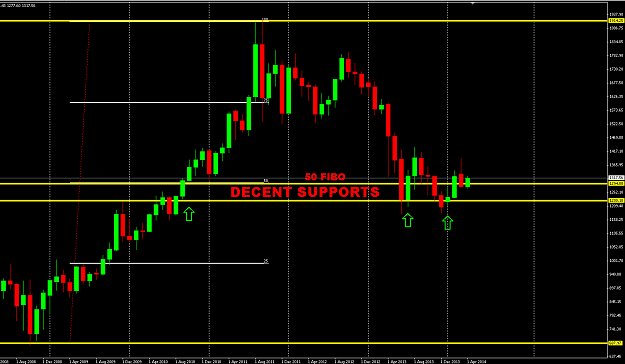
I use several factors to analyze the markets, like long term cycles. I'm a strong
believer in divergence, if combined with trendlines and a clear elliot wave pattern.

I do not rely on EW alone, it has to match up with several other factors like time, trendlines,
and other indicators. Fibonacci is also very useful if combined with support and resistance levels.

What's certain is that I WILL be wrong from time to time, but right now I'm
seeing some decent patterns that may pan out quite soon. Lets do some
estimated analyses and then let the market tell us the patch soon enough :-).

Hope you enjoy.

- Oddvin
  • Post #2
  • Quote
  • Apr 6, 2014 4:46pm Apr 6, 2014 4:46pm
  •  enterfx
  • | Joined Nov 2009 | Status: The Trend is Your Friend | 1,123 Posts
EURUSD Weekly - Soon to set off a solid trend:


My prediction is that we are in the very late stage of this long lasting flag pattern
that started in July 2012.

It's now been 88 weeks and lately price seem to go nowhere as it has become more and more
choppy in a tighter and tigther trading range. I, (like many others) have been scratching
heads about the recent months price action but I think there is a good reason for this
choppiness as explained below and on the chart.

We are now at the same price level as we were in October and Desember through February,
but it wont last for much longer because it will soon catapult and release the energy
it's been building over the past few months.

Some people think it will break to the upside since it's made new highs and higher lows.
They may be right but in my opinion there's a clear pattern that tells me the EURUSD will
break down in a massive trend to come.

Unless it's already done to the upside and breaks down hard from current levels, I think we
could see a final leg towards the 1.40 level to conclude a big ending diagonal.


WEEKLY CHART

Attached Image (click to enlarge)
Click to Enlarge

Name: eurusdweekly0404.png
Size: 117 KB
 
 
  • Post #3
  • Quote
  • Edited 5:00pm Apr 6, 2014 4:46pm | Edited 5:00pm
  •  enterfx
  • | Joined Nov 2009 | Status: The Trend is Your Friend | 1,123 Posts
GOLD XAU/USD -- Weekly and monthly analyses

There's been plenty of calls that gold has made a bottom and the trend has resumed to the upside.
I find some missing pieces in the long term picture for this to be the case. While it remains to
see over the next few weeks, I think we are heading sidewise and lower for the rest of the year.

The gold bulls has been soaring again, too many, too fast.
Technically, in my opinion, we do not have a good reversal pattern to call for a bottom.
It allways takes time to turn a large ship 180 degrees.

With a 12 year bull run, a 3 year correction isn't too much. Just 3-4 years ago price was
trading at the $1100 level with a low in 2010 at $1042. We may head towards that level before
the trend changes again.

The recent rally was pretty strong and firm, but in my opinion, likely a C-wave rally.
C-waves are usually strong untill they stop dead.

The alternative is of course if this is a new uptrend, we should soon see gold take
off and hit new highs. If this does not happen over the next few weeks and starts
choppy and lower trading we can assume we are in either a triangle or start of a 5th wave lower.


Weekly chart:

Attached Image (click to enlarge)
Click to Enlarge

Name: xauusdweekly0604.png
Size: 129 KB


Monthly:

Attached Image (click to enlarge)
Click to Enlarge

Name: xauusdmonthly0604.png
Size: 78 KB
 
 
  • Post #4
  • Quote
  • Edited 5:10pm Apr 6, 2014 4:47pm | Edited 5:10pm
  •  enterfx
  • | Joined Nov 2009 | Status: The Trend is Your Friend | 1,123 Posts
S&P Index (ES) -- Weekly & Daily chart analyses.

The next few days will be crucial for the small and mid term trend for the S&P index.

While it very possibly can shoot up to marginally new highs, many signs are now pointing to
lower prices and possibly a larger correction at the very least. Unless we see sideways and
higher prices in the next week or two, I think it's time for a small/mid term trend change
where I will look to sell the index in the coming week.

The trend is clearly up and at this stage a potential reversal is yet to be confirmed .
We do have solid daily reversal candle from friday's high, but currently there's
good support below and no significant pivot levels has so far been taken out.


Weekly chart:

Attached Image (click to enlarge)
Click to Enlarge

Name: _us500weekly0604-14.png
Size: 122 KB


Daily:

Attached Image (click to enlarge)
Click to Enlarge

Name: _us500daily0604.png
Size: 124 KB
 
 
  • Post #5
  • Quote
  • Edited 8:23pm Apr 6, 2014 7:39pm | Edited 8:23pm
  •  enterfx
  • | Joined Nov 2009 | Status: The Trend is Your Friend | 1,123 Posts
Quoting enterfx
Disliked
S&P Index (ES) -- Weekly & Daily chart analyses.
Ignored

Levels the S&P has to break to confirm a downturn is first a break of the yellow TL at 1840/1845 (ES) where we also find the 50 day EMA.
Next it has to take out 1833 and 1822 (ES), the recent lows where also the lower daily Bollinger band sits.

Break of these levels will likely trigger a bigger selloff.


Attached Image (click to enlarge)
Click to Enlarge

Name: _us500daily0704.png
Size: 123 KB
 
 
  • Post #6
  • Quote
  • Apr 7, 2014 10:26am Apr 7, 2014 10:26am
  •  enterfx
  • | Joined Nov 2009 | Status: The Trend is Your Friend | 1,123 Posts
Quoting enterfx
Disliked
EURUSD Weekly - Soon to set off a solid trend:
Ignored
EurUsd is ticking upwards again without breaking any key levels. So far we're on track. It also has room for another
low at the 3650 level before resuming upward to finish the last leg up.
 
 
  • Post #7
  • Quote
  • Apr 7, 2014 12:00pm Apr 7, 2014 12:00pm
  •  namaus
  • | Joined Nov 2013 | Status: Member | 284 Posts
Quoting enterfx
Disliked
GOLD XAU/USD -- Weekly and monthly analyses There's been plenty of calls that gold has made a bottom and the trend has resumed to the upside. I find some missing pieces in the long term picture for this to be the case. While it remains to see over the next few weeks, I think we are heading sidewise and lower for the rest of the year. The gold bulls has been soaring again, too many, too fast. Technically, in my opinion, we do not have a good reversal pattern to call for a bottom. It allways takes time to turn a large ship 180 degrees. With a 12 year...
Ignored
Gooo view. The thing is how long we wait to witness the trend. This trend suits for investors not for intraday traders. Tks. Keep your work.
 
 
  • Post #8
  • Quote
  • Apr 7, 2014 6:43pm Apr 7, 2014 6:43pm
  •  enterfx
  • | Joined Nov 2009 | Status: The Trend is Your Friend | 1,123 Posts
Quoting enterfx
Disliked
S&P Index (ES) -- Weekly & Daily chart analyses. {image}
Ignored
Follow up on the S&P ES :

Without a bounce today and continued selloff without breaking any key levels, makes this structure tricky as nothing is confirmed.
The 4Hour is now very oversold and the 1H and 30min timeframes is now showing divergence, so a hard bounce is likely in the
cards for tomorrow. The question then is if this leg has finished and wether new highs will be made.

The trend is still up utill we break 1823 ES (short term) . We have to remember that so far the trend has been monstrous
and I allways say that it takes time to turn a large ship, even after the motors has been shut off.

What we see now is maybe a topping pattern, because divergence are building on the daily and weekly charts.
The structure atm is very unclear and unconfirmed either ways

Attached Image (click to enlarge)
Click to Enlarge

Name: _us500daily0804.png
Size: 88 KB
 
 
  • Post #9
  • Quote
  • Apr 7, 2014 8:04pm Apr 7, 2014 8:04pm
  •  tlpfx14
  • | Joined Feb 2014 | Status: Member | 413 Posts
enter - a good thread! post often pls.

i like MA and BB
http://www.forexfactory.com/showthread.php?t=476524

perhaps exchange of trading views would be nice

what are the MA you used in the chart?

thanks
 
 
  • Post #10
  • Quote
  • Apr 7, 2014 9:01pm Apr 7, 2014 9:01pm
  •  enterfx
  • | Joined Nov 2009 | Status: The Trend is Your Friend | 1,123 Posts
Quoting tlpfx14
Disliked
enter - a good thread! post often pls. i like MA and BB http://www.forexfactory.com/showthread.php?t=476524 perhaps exchange of trading views would be nice what are the MA you used in the chart? thanks
Ignored
Thank you.

Blue = EMA50
Red = EMA200
I also use the EMA100, but not on this chart

The yellow line on top is the upper ATR keltner band.
 
 
  • Post #11
  • Quote
  • Apr 7, 2014 9:18pm Apr 7, 2014 9:18pm
  •  tlpfx14
  • | Joined Feb 2014 | Status: Member | 413 Posts
Quoting enterfx
Disliked
{quote} Thank you. Blue = EMA50 Red = EMA200 I also use the EMA100, but not on this chart The yellow line on top is the upper ATR keltner band.
Ignored

thanks, mate.
i feel that you are a senior trader

by the way, gold has been following silver on down movement since 2-3 weeks ago.
from yesterday, silver showing an inside bar (after mb).
potentially she will head south.
then gold to follow on.
http://www.forexfactory.com/showthre...68#post7389168

my 2 cents views.
trade happily.
cheers
 
 
  • Post #12
  • Quote
  • Apr 8, 2014 7:26am Apr 8, 2014 7:26am
  •  enterfx
  • | Joined Nov 2009 | Status: The Trend is Your Friend | 1,123 Posts
Quoting enterfx
Disliked
EURUSD Weekly - Soon to set off a solid trend:
Ignored

EURUSD update:

Possible scenario for the EurUsd. There is room for another low without breaking any keylevels.
The 4Hour is overbought and is showing hidden divergence.

Attached Image (click to enlarge)
Click to Enlarge

Name: eurusdh4-0804.png
Size: 71 KB
 
 
  • Post #13
  • Quote
  • Apr 8, 2014 12:44pm Apr 8, 2014 12:44pm
  •  enterfx
  • | Joined Nov 2009 | Status: The Trend is Your Friend | 1,123 Posts
Quoting enterfx
Disliked
{quote} Follow up on the S&P ES : Without a bounce today and continued selloff without breaking any key levels, makes this structure tricky as nothing is confirmed. The 4Hour is now very oversold and the 1H and 30min timeframes is now showing divergence, so a hard bounce is likely in the cards for tomorrow.
Ignored
Follow up on the S&P ES :
So far, Looks like equal legs down in a possible correction and a so called "flat" correction. Flats takes out all lows except the lowest. Very tricky.

What makes me think it was a C-wave down from Friday, is because it had a C wave / 3rd wave momentum/selloff without a 1st and 2nd wave.
If this is correct, as long as 1823 ES holds, prices should go further north in the coming days.

Attached Image (click to enlarge)
Click to Enlarge

Name: _us500h4-0804.png
Size: 65 KB
 
 
  • Post #14
  • Quote
  • Apr 9, 2014 2:42am Apr 9, 2014 2:42am
  •  skyhok
  • Joined Feb 2014 | Status: Member | 1,794 Posts
Quoting enterfx
Disliked
{quote} Follow up on the S&P ES : So far, Looks like equal legs down in a possible correction and a so called "flat" correction. Flats takes out all lows except the lowest. Very tricky. What makes me think it was a C-wave down from Friday, is because it had a C wave / 3rd wave momentum/selloff without a 1st and 2nd wave. If this is correct, as long as 1823 ES holds, prices should go further north in the coming days. {image}
Ignored
First, let me congregulate you for starting such a meaningful thread.
Keep up the good work.

I'm actually trading S&P500 on a demo account learning from it, I've similar counts to your a-b-c flat, and expecting a wave c up equal to a.
Attached Image (click to enlarge)
Click to Enlarge

Name: spx500h4 0b.png
Size: 34 KB

Wave (c) of the flat looks complete, with an interesting overflow of wave v.
Attached Image (click to enlarge)
Click to Enlarge

Name: spx500m30.png
Size: 29 KB
Elliott Wave for optimum entry, exit and risk management of trades
 
 
  • Post #15
  • Quote
  • Apr 10, 2014 1:08pm Apr 10, 2014 1:08pm
  •  enterfx
  • | Joined Nov 2009 | Status: The Trend is Your Friend | 1,123 Posts
Quoting skyhok
Disliked
{quote} First, let me congregulate you for starting such a meaningful thread. Keep up the good work. I'm actually trading S&P500 on a demo account learning from it, I've similar counts to your a-b-c flat, and expecting a wave c up equal to a. {image} Wave (c) of the flat looks complete, with an interesting overflow of wave v. {image}
Ignored

Thanks skyhok. I haven't been at my computer for the past couple days but thanks for your charts. Looks good. However today's downmove looks real ugly thus far. Atm it looks like a 3rd wave, unless we get a strong upmove soon, remains to see.
 
 
  • Post #16
  • Quote
  • Apr 11, 2014 10:58am Apr 11, 2014 10:58am
  •  skyhok
  • Joined Feb 2014 | Status: Member | 1,794 Posts
Hi enterfx,
Thanks for your response for the last post.
I also have a long term view on EURUSD which I posted in 'Elliott Wave Trading' thread #post 6747. I thought it would be more appropriate there with the EW counts. I believe this count fits in with the complex triangular corrective pattern of the past 5 years that baffles many people.
Please take a look, like to get your view on it.
Elliott Wave for optimum entry, exit and risk management of trades
 
 
  • Post #17
  • Quote
  • Apr 12, 2014 5:59pm Apr 12, 2014 5:59pm
  •  Rtm
  • Joined Jan 2011 | Status: dump and pump | 4,055 Posts
I got some long term investments going into the SP500 now February started the year off on a great note and looking to continue with the bullish engulfing candle on our monthly chart. The thing is projection wise I will simply just be trailing my stop as price will be making fresh highs once back up there. Should price make a bigger correction my stop will be below 1700.
Attached Image (click to enlarge)
Click to Enlarge

Name: Selection_006.png
Size: 13 KB
All posts are my personal opinion
 
 
  • Post #18
  • Quote
  • Apr 13, 2014 6:35am Apr 13, 2014 6:35am
  •  aeternum
  • | Joined Aug 2012 | Status: Member | 2,263 Posts
Quoting Rtm
Disliked
I got some long term investments going into the SP500 now February started the year off on a great note and looking to continue with the bullish engulfing candle on our monthly chart. The thing is projection wise I will simply just be trailing my stop as price will be making fresh highs once back up there. Should price make a bigger correction my stop will be below 1700. {image}
Ignored
What about the bearish engulfing that comes right after?
A 1 pip gain is better than a 1 pip loss.
 
 
  • Post #19
  • Quote
  • Apr 13, 2014 7:38am Apr 13, 2014 7:38am
  •  ruffryders
  • | Commercial Member | Joined Jan 2011 | 4,044 Posts
nice review and charts enterfx. GOLD is a bit more simple. Above 1300 it's mildly bullish, however GOLD will need to break above 1380-1420 to have a shot at starting a decent move / possible uptrend. current price action looks OK, but mild, supported by a double bottom on weeklies.

Overall, mixed outlook currently. Building up a LONG position in GOLD requires for price to close above 1400, at least for me.

here's monthly chart with 50 fibo and support zone. Don't overlook the current strong support zone.
Attached Image (click to enlarge)
Click to Enlarge

Name: Screenshot1.png
Size: 48 KB
 
 
  • Post #20
  • Quote
  • Apr 13, 2014 8:09am Apr 13, 2014 8:09am
  •  Rtm
  • Joined Jan 2011 | Status: dump and pump | 4,055 Posts
Quoting aeternum
Disliked
{quote} What about the bearish engulfing that comes right after?
Ignored
well for one its not even closed yet and secondmto consider that going against that huge uptrend with this tiny little bearish engulfing bar is a gamble imo, looks more like people just taking profit.
All posts are my personal opinion
 
 
  • Interactive Trading
  • /
  • Long Term Analyses - EURUSD, GOLD, and S&P
  • Reply to Thread
    • Page 1 23 4
    • Page 1 23 4
0 traders viewing now
  • More
Top of Page
  • Facebook
  • Twitter
About FF
  • Mission
  • Products
  • User Guide
  • Media Kit
  • Blog
  • Contact
FF Products
  • Forums
  • Trades
  • Calendar
  • News
  • Market
  • Brokers
  • Trade Explorer
FF Website
  • Homepage
  • Search
  • Members
  • Report a Bug
Follow FF
  • Facebook
  • Twitter

FF Sister Sites:

  • Metals Mine
  • Energy EXCH
  • Crypto Craft

Forex Factory® is a brand of Fair Economy, Inc.

Terms of Service / ©2023