GBPUSD Weekly Technical Outlook
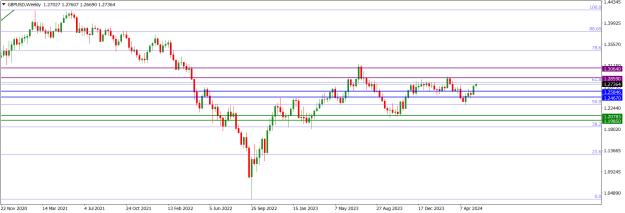
GBPUSD market operation on the weekly time went sideways last week upon a retest of the 68 Fib area of the bearish swing that began in May 2021. There was a relatively strong bullish charge at the area two weeks ago, but further bullish move last week was curtailed by a bearish challenge.
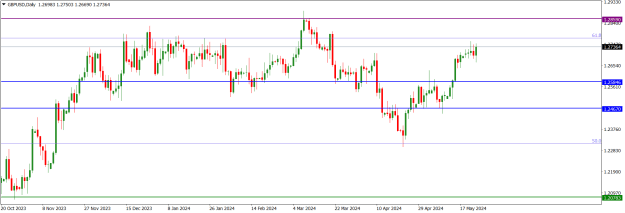
GBPUSD price action on the daily time frame made a bullish charge at the 68 Fib area of the bearish swing that began in May 2021 on Friday but was resisted by bears, resulting in a long-tailed doji. Further bullish charge at the area occurred on Friday. Technically, we may see a further northward move in the early part f this week. But the dominant technical structure is bearish, and such northward momentum would be short lived.
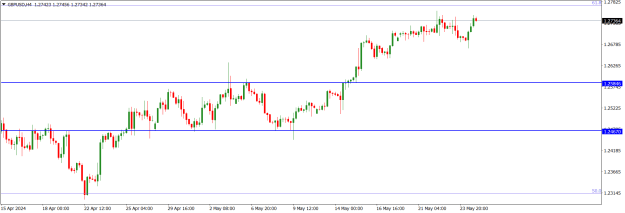
Although GBPUSD price action on the H4 time frame is presently sideways. The short-term impulse favours further northward move. Nevertheless, the dominant technical structure is bearish.
I may be wrong. Trade safe and prosper.
KP
GBPUSD market operation on the weekly time went sideways last week upon a retest of the 68 Fib area of the bearish swing that began in May 2021. There was a relatively strong bullish charge at the area two weeks ago, but further bullish move last week was curtailed by a bearish challenge.
Attached Image (click to enlarge)
GBPUSD price action on the daily time frame made a bullish charge at the 68 Fib area of the bearish swing that began in May 2021 on Friday but was resisted by bears, resulting in a long-tailed doji. Further bullish charge at the area occurred on Friday. Technically, we may see a further northward move in the early part f this week. But the dominant technical structure is bearish, and such northward momentum would be short lived.
Attached Image (click to enlarge)
Although GBPUSD price action on the H4 time frame is presently sideways. The short-term impulse favours further northward move. Nevertheless, the dominant technical structure is bearish.
Attached Image (click to enlarge)
I may be wrong. Trade safe and prosper.
KP
Do your homework, follow the footprints of smart money