GBPUSD Weekly Technical Outlook
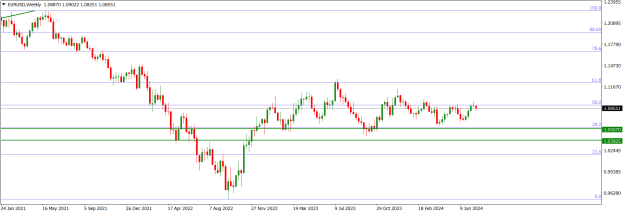
GBPUSD market operation on the weekly time frame is sideways. It is at the 1.26670 area, which is about 125 pips below the 61.8 Fib retracement of the bearish swing that began in May 2021. Market operation has been tackling the 1.26670 area in the past two weeks.

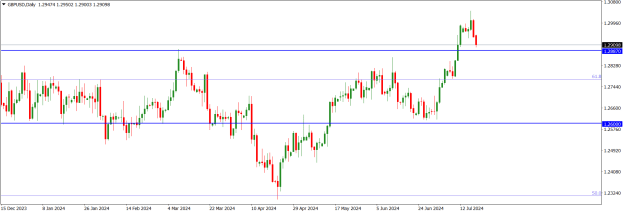
GBPUSD price action on the daily time frame has broken down a rising channel (magenta) within which it has been operating since May 2024. On Monday it made a bullish retest of the lower boundary of the channel before a bearish pushback. Presently, price action is sideways below the channel. Technically we may expect a bearish turnround should bulls fail to gain a bullish momentum in the early part of this week.

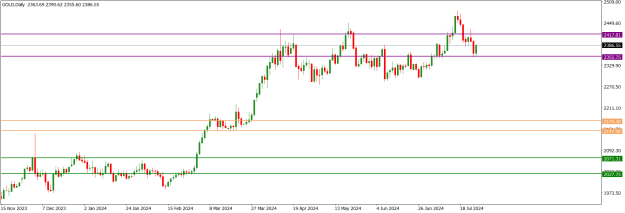
GBPUSD price action went sideways as it retests the 1.26430 intra-day horizontal resistance. The technical impulse favours bears more than bulls. The dominant technical structure is bearish.

I may be wrong. Trade safe and prosper.
KP
GBPUSD market operation on the weekly time frame is sideways. It is at the 1.26670 area, which is about 125 pips below the 61.8 Fib retracement of the bearish swing that began in May 2021. Market operation has been tackling the 1.26670 area in the past two weeks.
Attached Image (click to enlarge)
GBPUSD price action on the daily time frame has broken down a rising channel (magenta) within which it has been operating since May 2024. On Monday it made a bullish retest of the lower boundary of the channel before a bearish pushback. Presently, price action is sideways below the channel. Technically we may expect a bearish turnround should bulls fail to gain a bullish momentum in the early part of this week.
Attached Image (click to enlarge)
GBPUSD price action went sideways as it retests the 1.26430 intra-day horizontal resistance. The technical impulse favours bears more than bulls. The dominant technical structure is bearish.
Attached Image (click to enlarge)
I may be wrong. Trade safe and prosper.
KP
Do your homework, follow the footprints of smart money