GBPUSD Weekly Technical Outlook
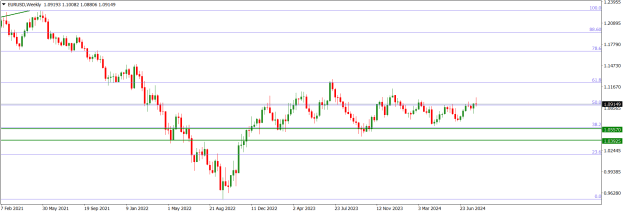
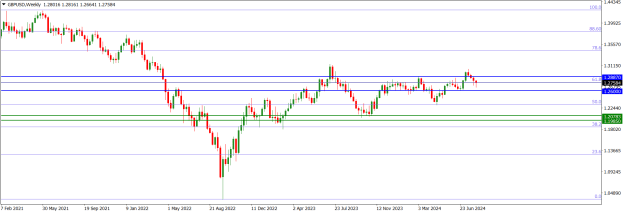
GBPUSD market operation on the weekly time frame printed an ambivalent candlestick last week. Market operation made a bearish retest of the 61.8 Fib retracement area of the bearish swing that began in May 2021. We may see a bullish pushback in the early part of this week.

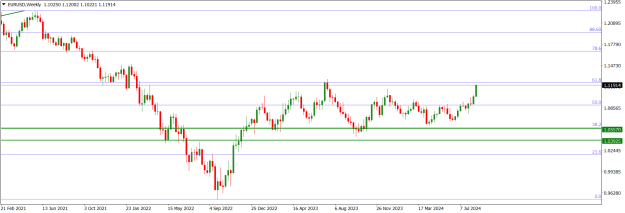
Last Thursday GBPUSD price action on the daily time frame broke below the 61.8 Fib retracement area of the bearish swing that began in May 2021. But there was no bearish follow-up on Friday as bulls pushed back the bearish drive. We may still see further bullish pushback in the early part of this week.

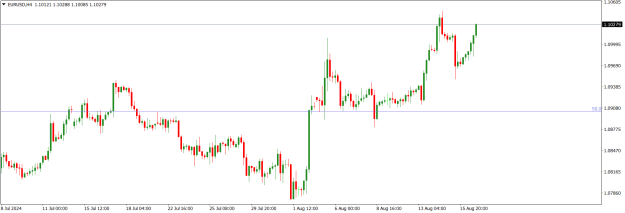
GBPUSD price action went sideways towards the end of Friday after a bearish break below the 61.8 Fib retracement area of the bearish swing that began in May 2021. As there was a relatively strong bullish pushback before price action went sideways, we may see further northward move in the early part of the week.

I may be wrong. Trade safe and prosper.
KP
GBPUSD market operation on the weekly time frame printed an ambivalent candlestick last week. Market operation made a bearish retest of the 61.8 Fib retracement area of the bearish swing that began in May 2021. We may see a bullish pushback in the early part of this week.
Attached Image (click to enlarge)
Last Thursday GBPUSD price action on the daily time frame broke below the 61.8 Fib retracement area of the bearish swing that began in May 2021. But there was no bearish follow-up on Friday as bulls pushed back the bearish drive. We may still see further bullish pushback in the early part of this week.
Attached Image (click to enlarge)
GBPUSD price action went sideways towards the end of Friday after a bearish break below the 61.8 Fib retracement area of the bearish swing that began in May 2021. As there was a relatively strong bullish pushback before price action went sideways, we may see further northward move in the early part of the week.
Attached Image (click to enlarge)
I may be wrong. Trade safe and prosper.
KP
Do your homework, follow the footprints of smart money