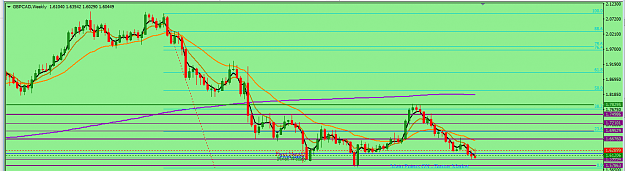
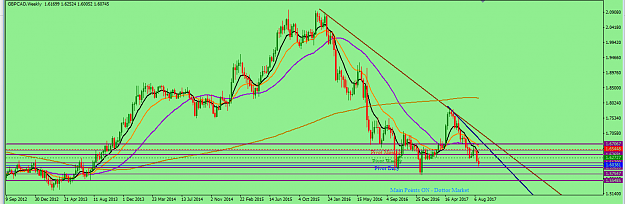
GBPCAD Weekly Technical Outlook
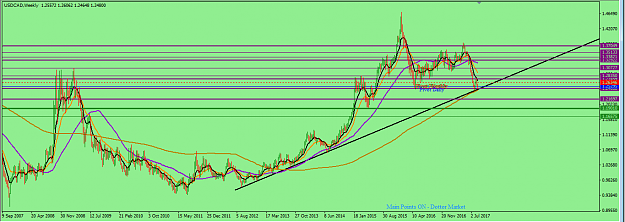
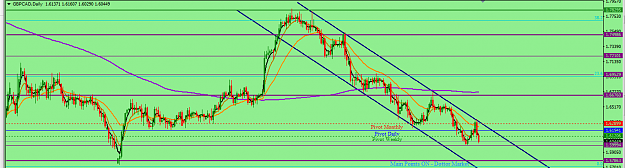
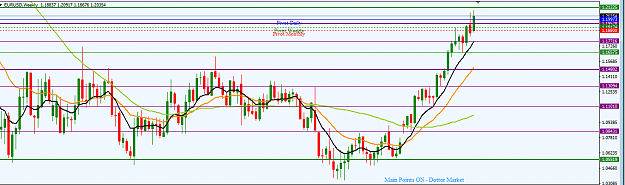
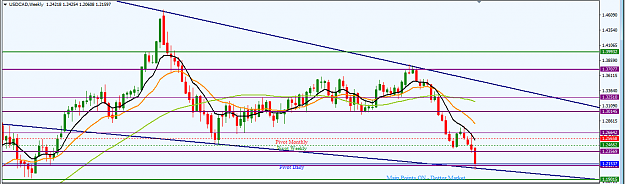
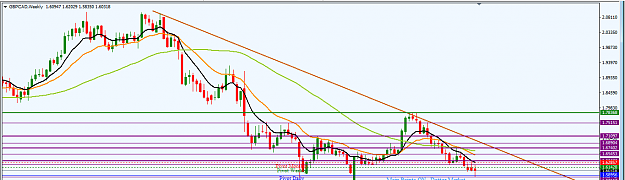
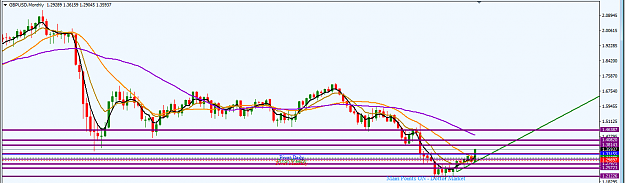
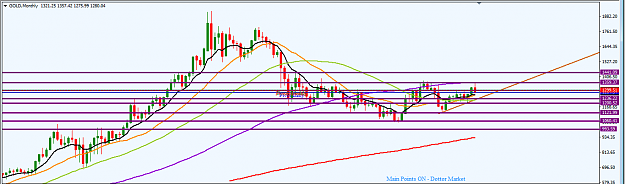
After a drop from the high of December 2015 to the low of September 2016 and its 38.2 Fib retracement, which happened in April 2017, the pair has been on a southward move on the monthly time frame since May 2017.
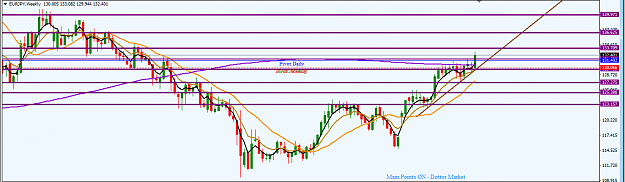
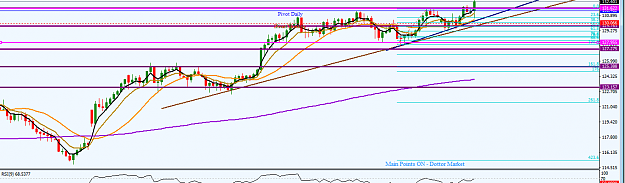
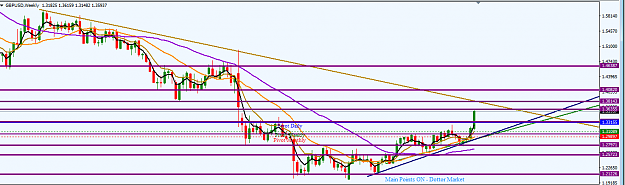
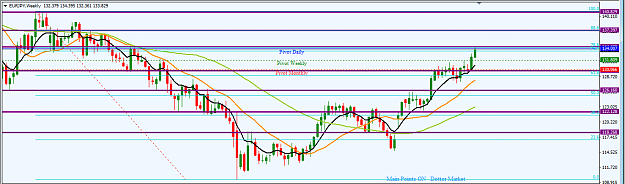
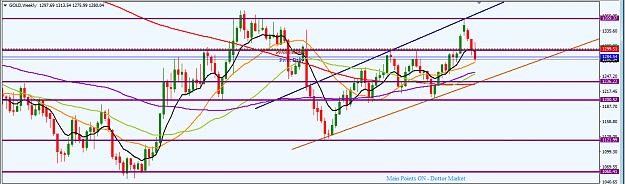
On the weekly time frame, the pair is respecting a resistance trendline (saddlebrown colour) from the high of January 2016. An inner resistance trendline (navy colour) from the high of May 2017 has developed, which indicates an increased southward momentum. Two weeks ago, a relatively strong bearish candlestick formed, which rejected the monthly central pivot southward and pierced a strong support zone around the 1.62300 area. However, last week’s candlestick was ambivalent in nature as sellers were only able to take the price just about 130 pips southward before they met resistance from buyers. This candlestick appeared to be a follow through of the bearish pinbar formed three weeks ago. Should sellers maintain control of the order flow, a likely target is the 1.59760 area. Current price action is just about 130 pips shy of the immediate support zone around the 1.59510 area. Should sellers manage to push price southward, that area is likely to be a natural target. This may extend to the 1.57780 area in the next few days. That area marked the low of 2016 and has been so for many years since the low of August 2013. However, should buyers manage to wrestle control of price action, we may see a retest of the immediate support around the 1.62720 area.
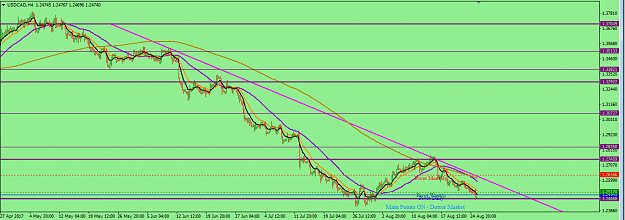
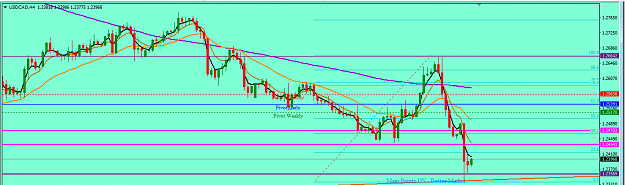
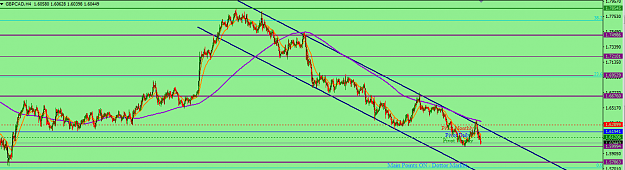
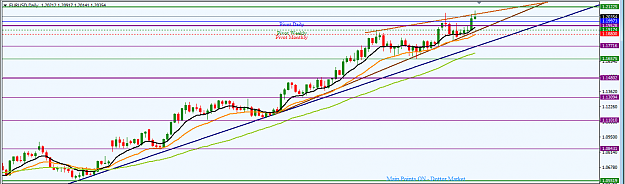
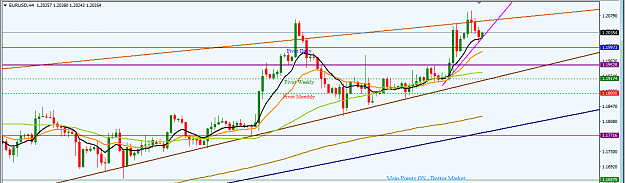
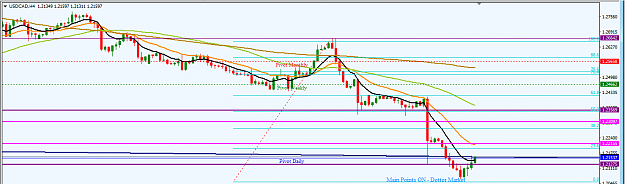
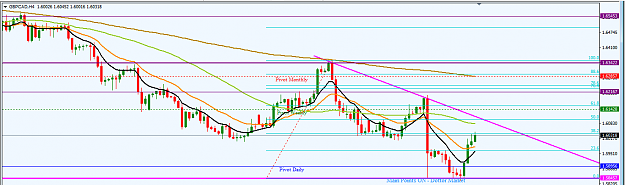
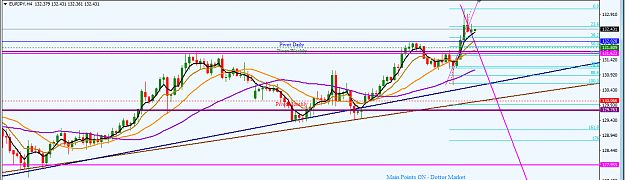
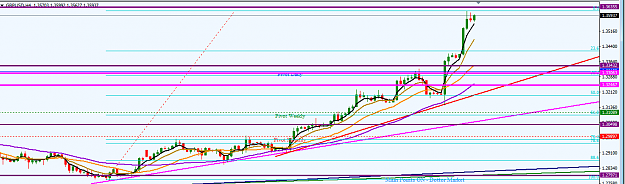
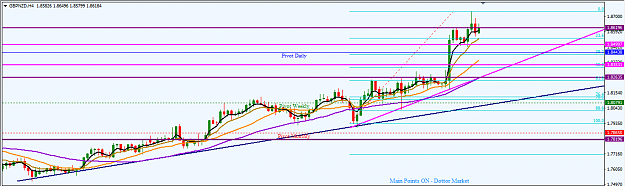
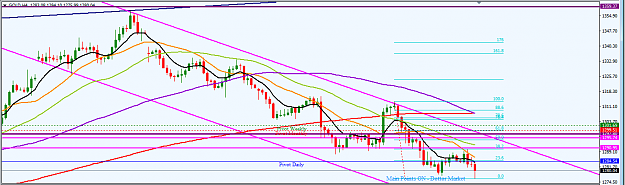
On the H4 time frame, price action is respecting a resistance trendline (magenta colour) from the high of June 8, 2016. However, the last sessions on Friday saw buyers taking charge of price action and we may see a retracement northward, possibly to the 30/50 Fib retracement zone of the swing from the high of August 3, 2017 to last Friday’s low (bound by the two magenta coloured horizontal lines), between 1.62302 and 1.63370.
I may be wrong. Trade safe and prosper.
KP
After a drop from the high of December 2015 to the low of September 2016 and its 38.2 Fib retracement, which happened in April 2017, the pair has been on a southward move on the monthly time frame since May 2017.
On the weekly time frame, the pair is respecting a resistance trendline (saddlebrown colour) from the high of January 2016. An inner resistance trendline (navy colour) from the high of May 2017 has developed, which indicates an increased southward momentum. Two weeks ago, a relatively strong bearish candlestick formed, which rejected the monthly central pivot southward and pierced a strong support zone around the 1.62300 area. However, last week’s candlestick was ambivalent in nature as sellers were only able to take the price just about 130 pips southward before they met resistance from buyers. This candlestick appeared to be a follow through of the bearish pinbar formed three weeks ago. Should sellers maintain control of the order flow, a likely target is the 1.59760 area. Current price action is just about 130 pips shy of the immediate support zone around the 1.59510 area. Should sellers manage to push price southward, that area is likely to be a natural target. This may extend to the 1.57780 area in the next few days. That area marked the low of 2016 and has been so for many years since the low of August 2013. However, should buyers manage to wrestle control of price action, we may see a retest of the immediate support around the 1.62720 area.
Attached Image (click to enlarge)
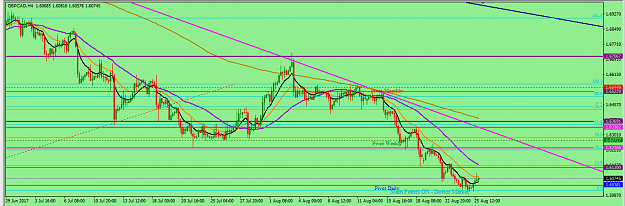
On the H4 time frame, price action is respecting a resistance trendline (magenta colour) from the high of June 8, 2016. However, the last sessions on Friday saw buyers taking charge of price action and we may see a retracement northward, possibly to the 30/50 Fib retracement zone of the swing from the high of August 3, 2017 to last Friday’s low (bound by the two magenta coloured horizontal lines), between 1.62302 and 1.63370.
Attached Image (click to enlarge)
I may be wrong. Trade safe and prosper.
KP
Do your homework, follow the footprints of smart money