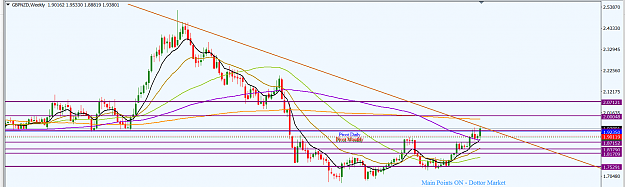
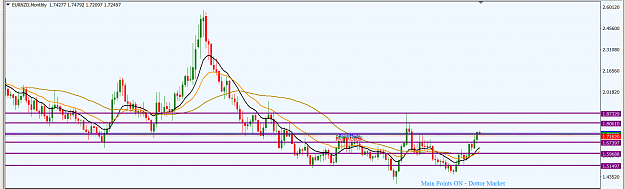
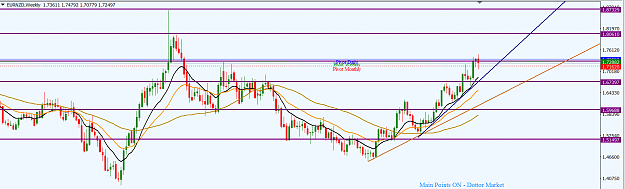
EURNZD Weekly Technical Outlook
Technically, the NZD has been on the southward mode against the majors in the recent past. The situation obtains on this pair. On the weekly time frame the pair has moved away further upward from an outer ascending trendline (chocolate colour) to respect an inner ascending trendline (navy colour), indicating an increase in momentum. Last week, the price action broke away from the monthly central pivot to retest a resistance zone in the 1.73350 area.
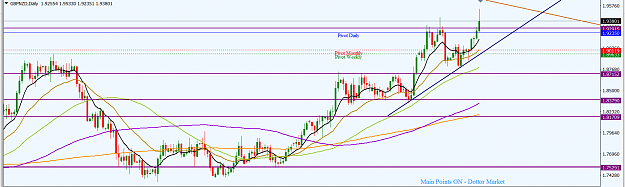
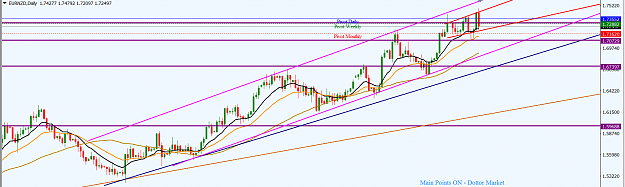
On the daily time frame, price action is respecting a support trendline (red colour) but it has moved too far from the trendline and an area of value. This, coupled with the fact that the most recent swing high is close to the one before it, indicates that a pullback is likely to be in the offing. Such a pull back may see price action retesting the support trendline (red colour) or at least the immediate horizontal support around the 1.69370 area (equivalent to a 61.8 Fib retracement of the most recent swing up). In fact, bears managed to push back the price last week Friday. We may expect a follow through early this week.
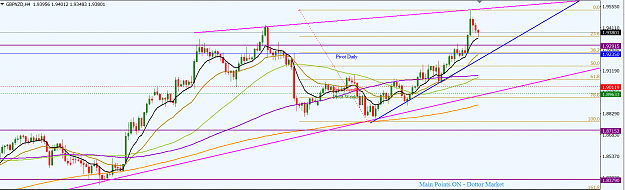
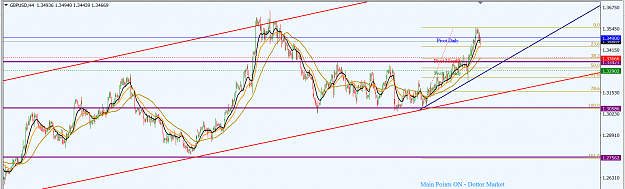
On the H4 time frame, price action is respecting a support trendline (magenta colour) from the low of November 8, 2017. However, the momentum has decreased and bears are beginning to become more influential. They may push price action to retest the trendline (magenta coloured) or even retrace to the immediate minor support zone around the 1.70320 area; which may extend to the 1.69370 area. This forms an immediate horizontal support zone; bound by bold, horizontal blue lines on the attached H4 chart. This zone represents the 50/61.8 Fib retracement zone of the most recent upward swing. Should this zone be defended by bulls, and turnaround northward, the bullish mode will continue. However, should the zone break southward, this may expose the next support around the 1.67935 area and dispose the pair to a bearish mode; potentially targeting the 1.66560 area.
I may be wrong. Trade safe and prosper.
KP
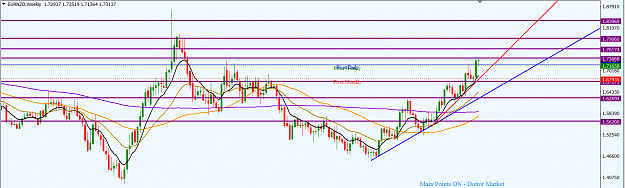
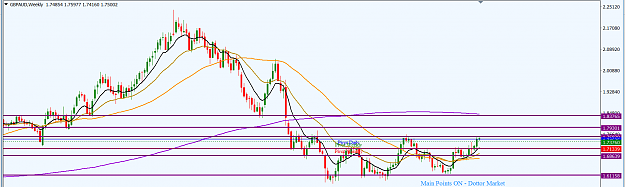
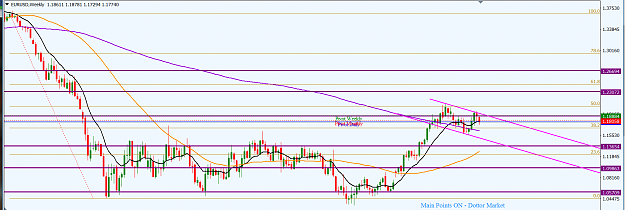
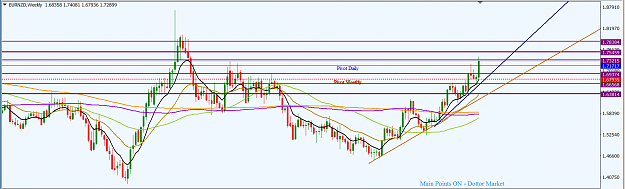
Technically, the NZD has been on the southward mode against the majors in the recent past. The situation obtains on this pair. On the weekly time frame the pair has moved away further upward from an outer ascending trendline (chocolate colour) to respect an inner ascending trendline (navy colour), indicating an increase in momentum. Last week, the price action broke away from the monthly central pivot to retest a resistance zone in the 1.73350 area.
Attached Image (click to enlarge)
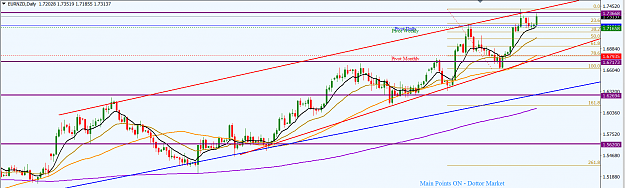
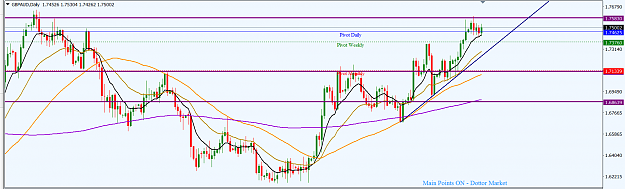
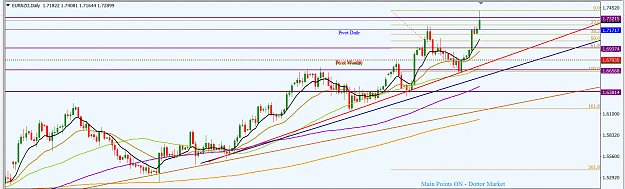
On the daily time frame, price action is respecting a support trendline (red colour) but it has moved too far from the trendline and an area of value. This, coupled with the fact that the most recent swing high is close to the one before it, indicates that a pullback is likely to be in the offing. Such a pull back may see price action retesting the support trendline (red colour) or at least the immediate horizontal support around the 1.69370 area (equivalent to a 61.8 Fib retracement of the most recent swing up). In fact, bears managed to push back the price last week Friday. We may expect a follow through early this week.
Attached Image (click to enlarge)
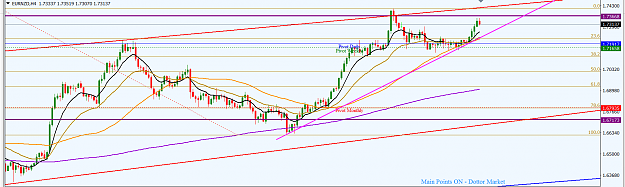
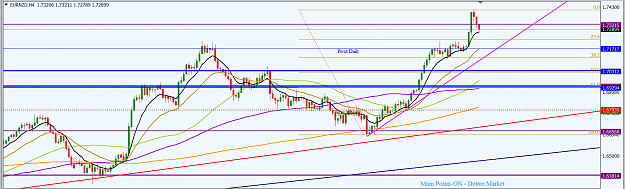
On the H4 time frame, price action is respecting a support trendline (magenta colour) from the low of November 8, 2017. However, the momentum has decreased and bears are beginning to become more influential. They may push price action to retest the trendline (magenta coloured) or even retrace to the immediate minor support zone around the 1.70320 area; which may extend to the 1.69370 area. This forms an immediate horizontal support zone; bound by bold, horizontal blue lines on the attached H4 chart. This zone represents the 50/61.8 Fib retracement zone of the most recent upward swing. Should this zone be defended by bulls, and turnaround northward, the bullish mode will continue. However, should the zone break southward, this may expose the next support around the 1.67935 area and dispose the pair to a bearish mode; potentially targeting the 1.66560 area.
Attached Image (click to enlarge)
I may be wrong. Trade safe and prosper.
KP
Do your homework, follow the footprints of smart money