AUDUSD Weekly Technical Outlook
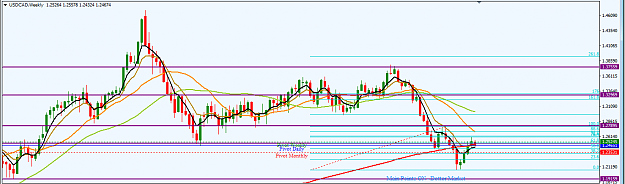
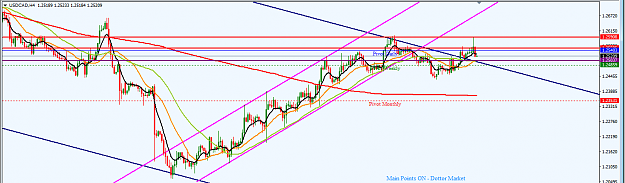
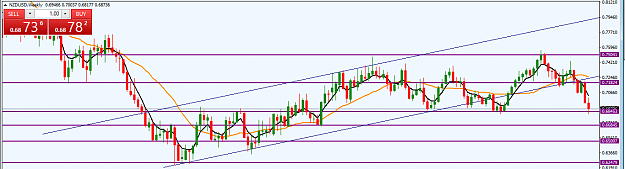
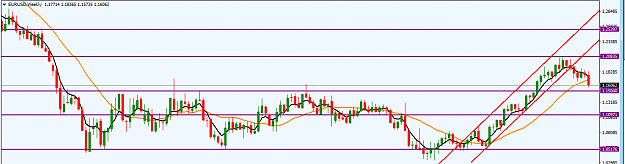
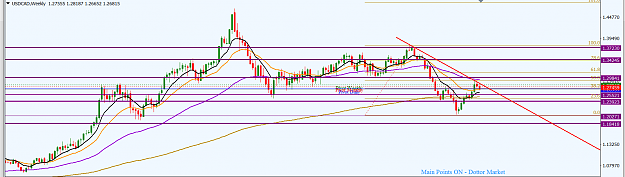
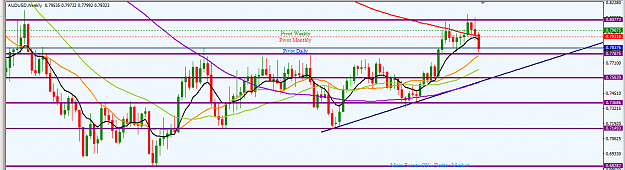
After a period of consolidation, the pair is disposed southward. On the weekly time frame, last week a bearish continuation candlestick formed. However, the last sessions of last week saw a strong attempt by bulls to restrain this move. And an ascending trendline (navy colour) from the low of December 2016 is still intact.
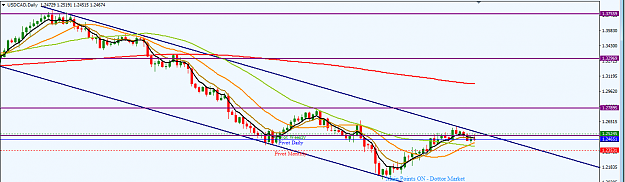
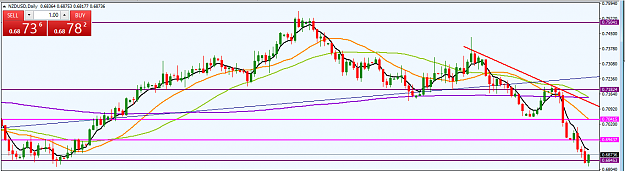
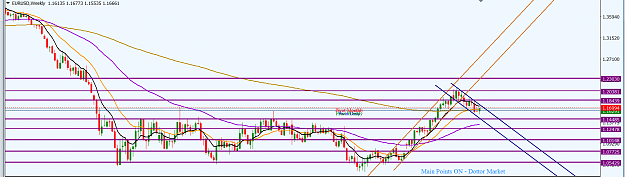
On the daily time frame, price action is operating within an ascending channel (bound by navy coloured lines) formed by the support trendline seen on the weekly time frame and a resistance trendline from the high of July 28, 2017. Two price waves have formed within the channel and third is in play from the distal channel line. The most recent price action has reached a significant support zone and this is in confluence with a support trendline (chocolate colour) from the low of June 1, 2017. The price action on Thursday and Friday last week was under the control of bulls and we may see a retracement to an area of value before further southward move. The target of such a retracement is likely to be the 0.79015 area, which is the immediate minor resistance on the daily time frame. However, should price action continue without a retracement, a break southward is likely to target the 0.77140 area.
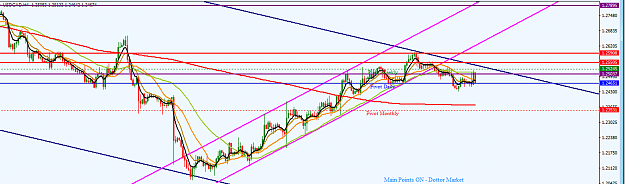
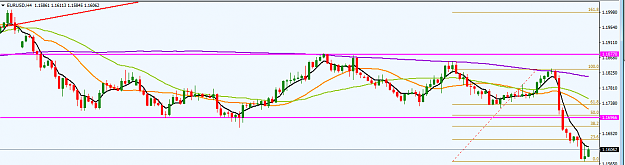
Price action on the H4 timeframe is respecting a resistance trendline (magenta colour). The technicals are largely biased in favour of bears. Therefore, very much likely and based on the bgiger picture from the weekly and daily time frames, we may expect a southward continuation in the medium term. The immediate target of such a southward move is the 0.78700 area.
I may be wrong. Trade safe and prosper.
KP
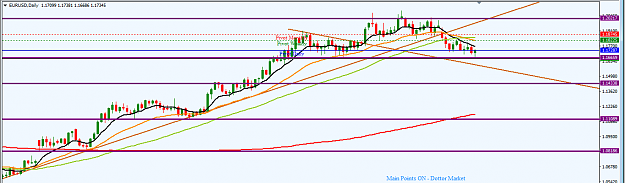
After a period of consolidation, the pair is disposed southward. On the weekly time frame, last week a bearish continuation candlestick formed. However, the last sessions of last week saw a strong attempt by bulls to restrain this move. And an ascending trendline (navy colour) from the low of December 2016 is still intact.
Attached Image (click to enlarge)
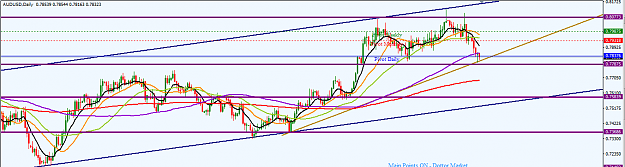
On the daily time frame, price action is operating within an ascending channel (bound by navy coloured lines) formed by the support trendline seen on the weekly time frame and a resistance trendline from the high of July 28, 2017. Two price waves have formed within the channel and third is in play from the distal channel line. The most recent price action has reached a significant support zone and this is in confluence with a support trendline (chocolate colour) from the low of June 1, 2017. The price action on Thursday and Friday last week was under the control of bulls and we may see a retracement to an area of value before further southward move. The target of such a retracement is likely to be the 0.79015 area, which is the immediate minor resistance on the daily time frame. However, should price action continue without a retracement, a break southward is likely to target the 0.77140 area.
Attached Image (click to enlarge)
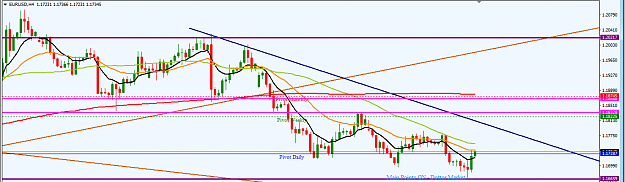
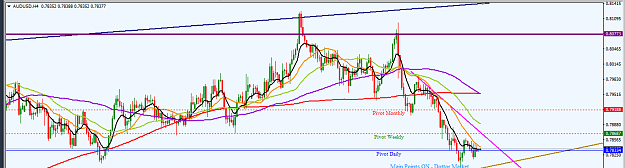
Price action on the H4 timeframe is respecting a resistance trendline (magenta colour). The technicals are largely biased in favour of bears. Therefore, very much likely and based on the bgiger picture from the weekly and daily time frames, we may expect a southward continuation in the medium term. The immediate target of such a southward move is the 0.78700 area.
Attached Image (click to enlarge)
I may be wrong. Trade safe and prosper.
KP
Do your homework, follow the footprints of smart money