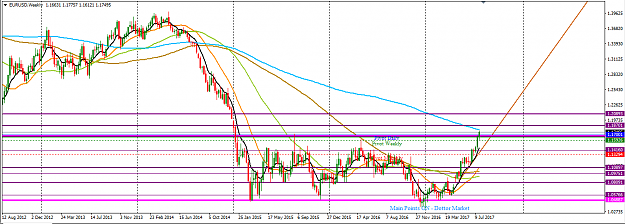
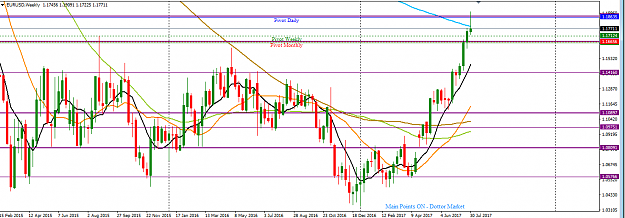
EURUSD Weekly Technical Outlook
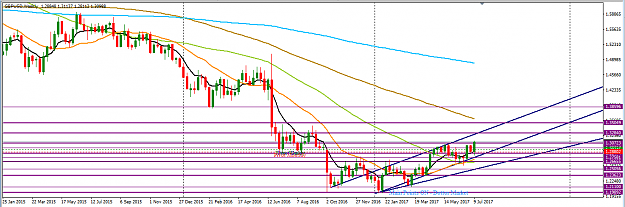
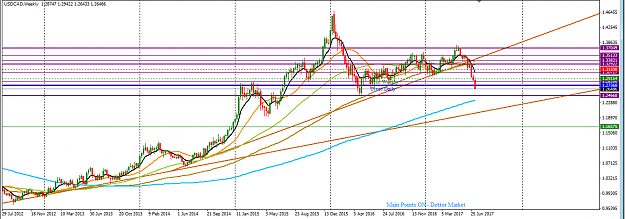
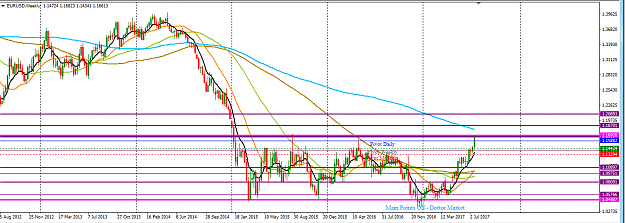
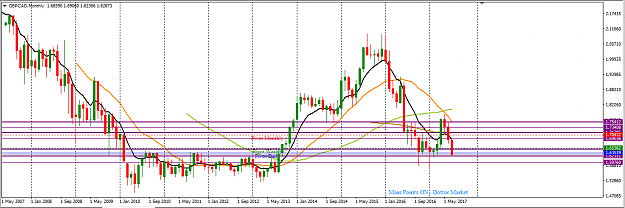
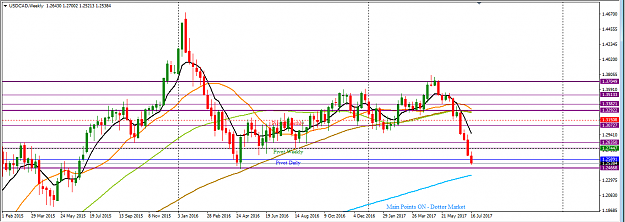
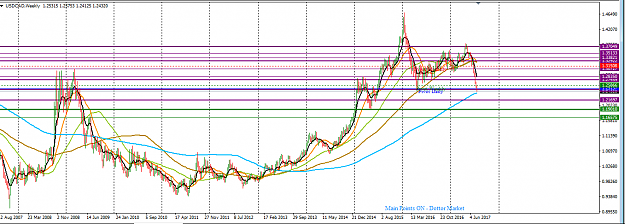
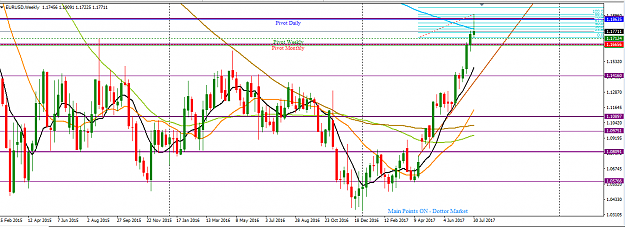
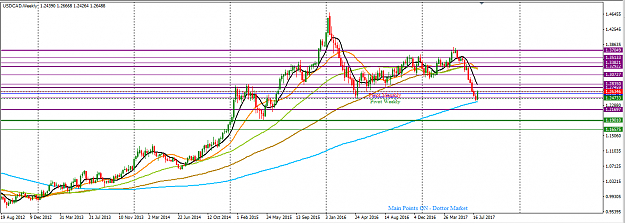
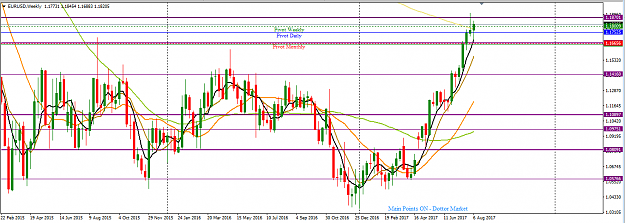
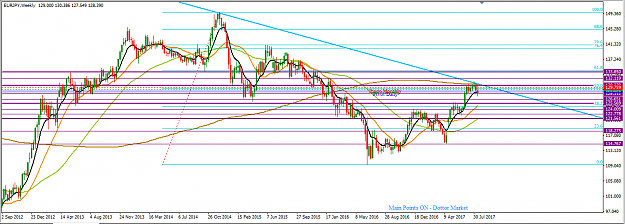
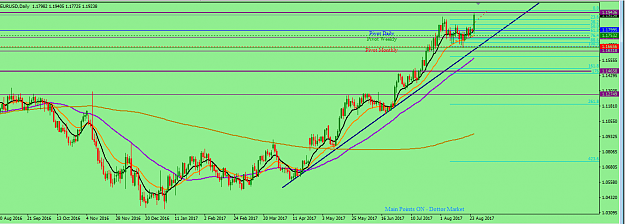
The pair has been largely north-bound for a relatively long period of time, although price action on a multi-year level has been within a defined range. Recent price action is at the distal part of the range. On the weekly time frame, the hammer-like candlestick formed two weeks ago was followed up by a bullish candlestick last week but the move lacked significant momentum as it was hindered by sellers who, towards the end of the session, pushed price southwards.
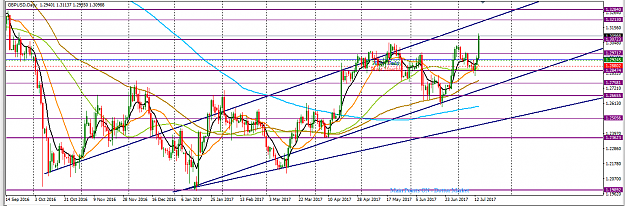
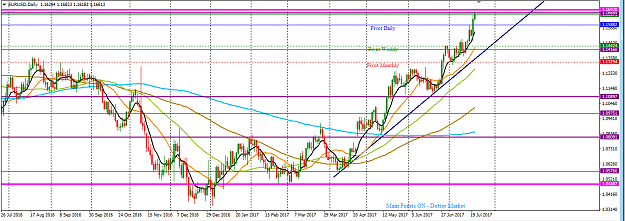
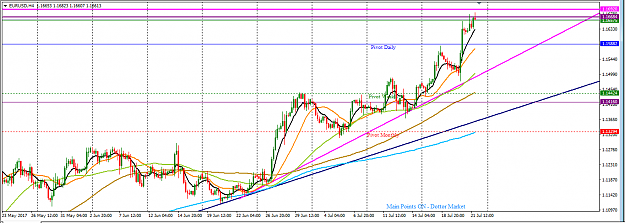
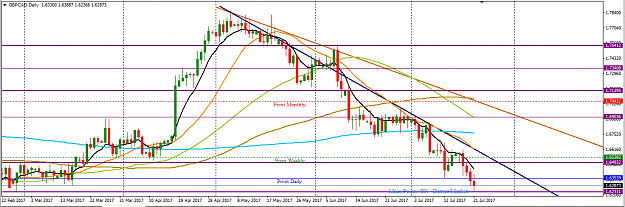
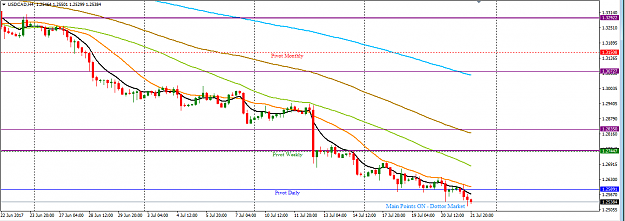
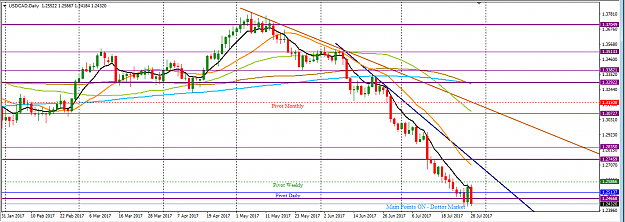
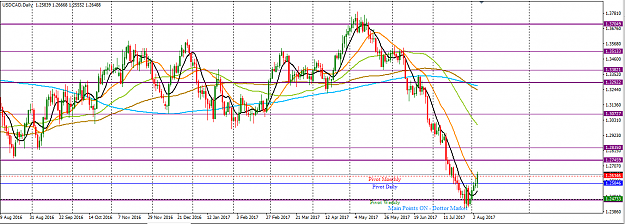
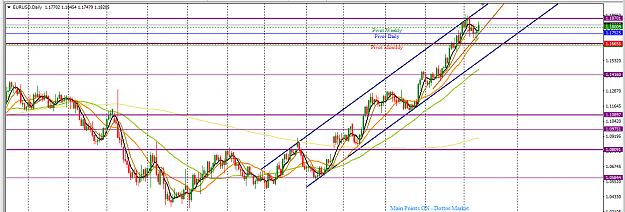
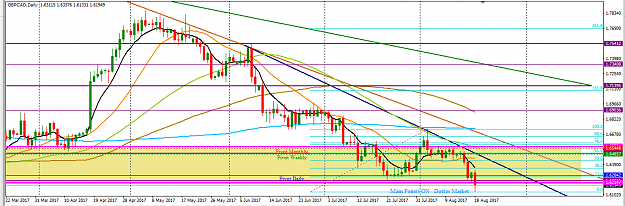
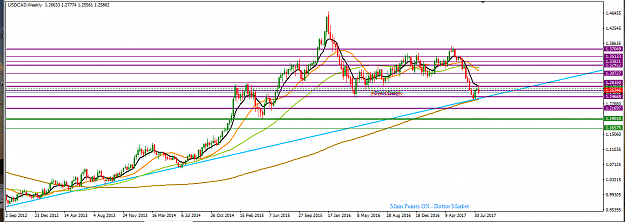
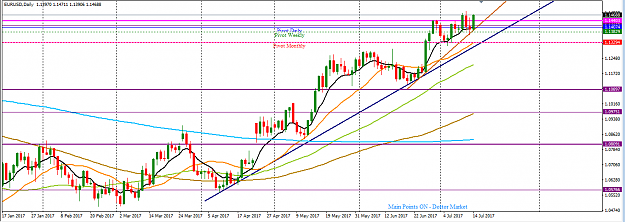
On the daily time frame, price action has moved northward of a major support trendline (navy colour) from the low of April 6, 2017 and it is respecting an inner support trendline (chocolate colour) from the low of June 23. However, for the most part of last week, daily price action has been in a consolidating mode. The most recent price action is at a distal part of the consolidation pattern and we may have another round of consolidation with a southward move towards the 1.13720 area, and even an extended pullback to the major support trendline (navy colour) before any further upward move. A successful break of the consolidation pattern upward is likely to meet resistance around the 1.15830 area. However, should price break the major support trendline (navy colour) southward, a likely target is the immediate support around the 1.12780 area. Such a move would be likely corrective in nature.
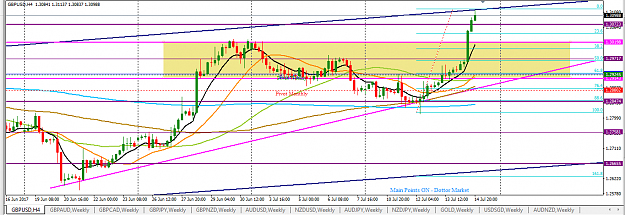
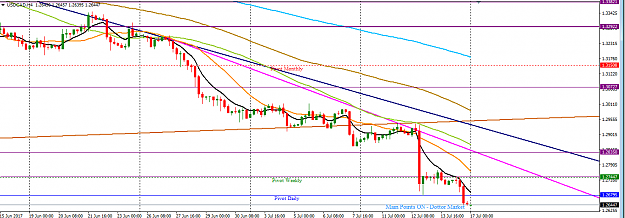
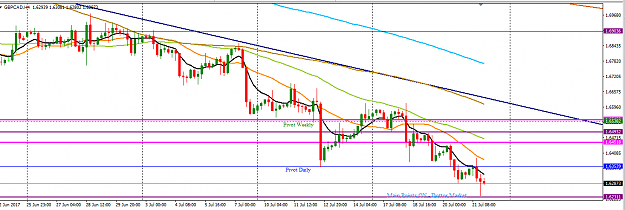
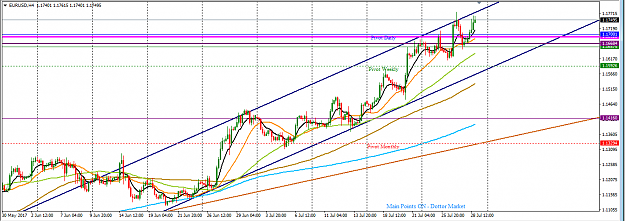
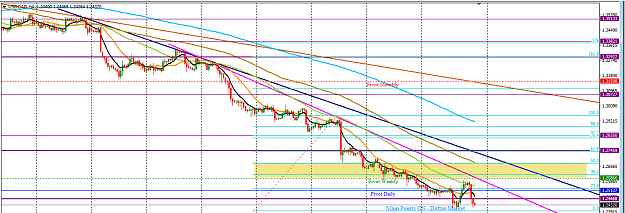
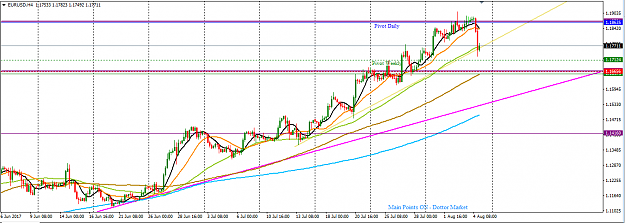
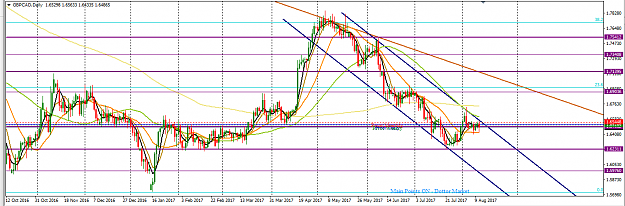
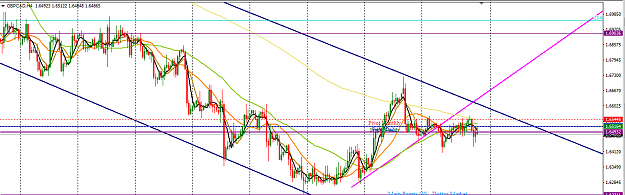
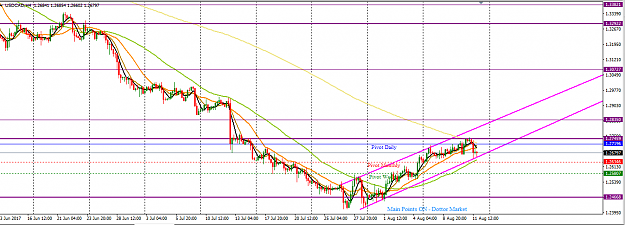
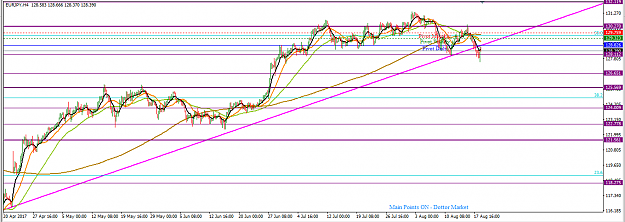
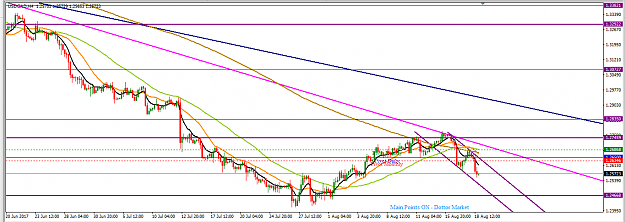
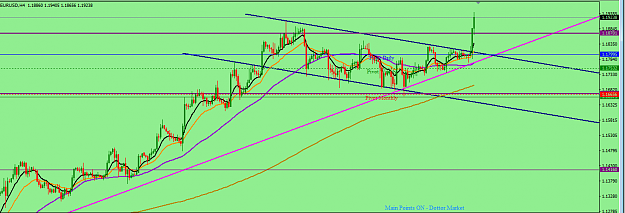
On the H4 time frame, price action has broken out distally from the channel (bound by two magenta-coloured horizontal lines) it formed a few weeks ago. However, we may expect another move southward to test the proximal part of the channel before momentum for a bullish operation can be assured. Alternatively, we may see price action move upward within a floating ascending channel (bound in chocolate coloured lines) formed by the support trendline from the low of June 23 and a resistance trendline from the high of July 7. This could happen if the hammer-like candlestick formed a session before the last H4 session on Friday is respected by price action. However, such a move is likely to be limited as the technicals are not in sync for a bullish momentum yet. A more sustainable operation is likely to be a short northward move followed by a southward turn-around to retest the support line of the horizontal channel (lower magenta-coloured line) around the 1.13290 area. This is likely to be medium-term in nature.
I may be wrong. Trade safe and prosper.
KP
The pair has been largely north-bound for a relatively long period of time, although price action on a multi-year level has been within a defined range. Recent price action is at the distal part of the range. On the weekly time frame, the hammer-like candlestick formed two weeks ago was followed up by a bullish candlestick last week but the move lacked significant momentum as it was hindered by sellers who, towards the end of the session, pushed price southwards.
On the daily time frame, price action has moved northward of a major support trendline (navy colour) from the low of April 6, 2017 and it is respecting an inner support trendline (chocolate colour) from the low of June 23. However, for the most part of last week, daily price action has been in a consolidating mode. The most recent price action is at a distal part of the consolidation pattern and we may have another round of consolidation with a southward move towards the 1.13720 area, and even an extended pullback to the major support trendline (navy colour) before any further upward move. A successful break of the consolidation pattern upward is likely to meet resistance around the 1.15830 area. However, should price break the major support trendline (navy colour) southward, a likely target is the immediate support around the 1.12780 area. Such a move would be likely corrective in nature.
Attached Image (click to enlarge)
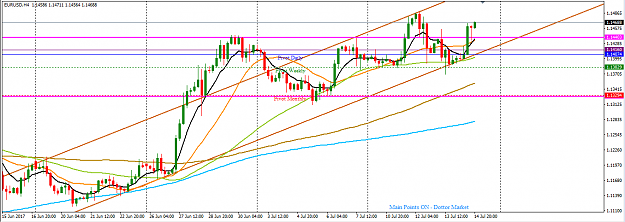
On the H4 time frame, price action has broken out distally from the channel (bound by two magenta-coloured horizontal lines) it formed a few weeks ago. However, we may expect another move southward to test the proximal part of the channel before momentum for a bullish operation can be assured. Alternatively, we may see price action move upward within a floating ascending channel (bound in chocolate coloured lines) formed by the support trendline from the low of June 23 and a resistance trendline from the high of July 7. This could happen if the hammer-like candlestick formed a session before the last H4 session on Friday is respected by price action. However, such a move is likely to be limited as the technicals are not in sync for a bullish momentum yet. A more sustainable operation is likely to be a short northward move followed by a southward turn-around to retest the support line of the horizontal channel (lower magenta-coloured line) around the 1.13290 area. This is likely to be medium-term in nature.
Attached Image (click to enlarge)
I may be wrong. Trade safe and prosper.
KP
Do your homework, follow the footprints of smart money
1