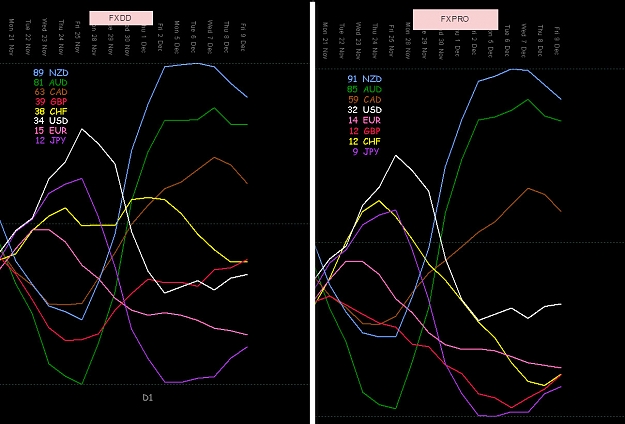
• Home
  • Forums
  • Trades
  • News
  • Calendar
  • Market
  • Brokers
  • Login
  • Join
  • User/Email: Password:
  • 10:32am
Menu
  • Forums
  • Trades
  • News
  • Calendar
  • Market
  • Brokers
  • Login
  • Join
  • 10:32am
Sister Sites
  • Metals Mine
  • Energy EXCH
  • Crypto Craft

Options

Bookmark Thread

First Page First Unread Last Page Last Post

Print Thread

Similar Threads

Recent Candles indicator 231 replies

Trading profitably using Recent Strength 58 replies

Recent Strength indicator 0 replies

Great recent strength indicator needs alert 0 replies

Recent Strength Idea 3 replies

  • Platform Tech
  • /
  • Reply to Thread
  • Subscribe
  • 314
Attachments: Recent Strength indicator
Exit Attachments
Tags: Recent Strength indicator
Cancel

Recent Strength indicator

  • Last Post
  •  
  • 1 1920Page 212223 44
  • 1 20Page 2122 44
  •  
  • Post #401
  • Quote
  • Edited 10:05pm Nov 30, 2011 8:16pm | Edited 10:05pm
  •  harora
  • | Joined Jul 2008 | Status: Sweep the pips | 536 Posts
Quoting hanover
Disliked
CSM (currency strength meter) is a histogram-based version of the 'Currency Strength - Giraia' indy. Download into the ...../experts/indicators folder, and restart MT4.

You will also need to install the 'Placard MT Condensed' font (included in the attached ZIP file), if you don't already have it.

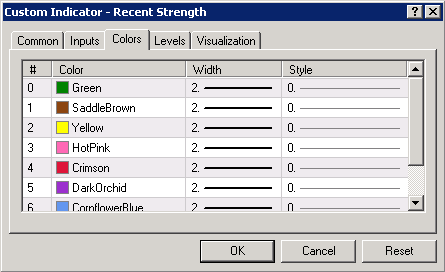
The parameters work as follows:

Currency Pairs - lists all 28 possible cross-products of AUD, CAD, CHF, EUR, GBP, JPY, NZD and USD. If your br0ker doesn't...
Ignored

Hi David,
I think I got this problem with vista solved by just running mt4 in administrator mode on vista and copying the indicator in programfiles\{mt4}\expert location. I think it would be worth mentioning on your first page for ppl using vista. but other installed ea's and indicators wont be available then unless all of them are copied into program files\{mt4}\expert folder.

[edit] best way i found that can be mentioned on the first page is to just copy whole mt4 folder into documents and run the terminal as administrator" [edit]

i had another indicator with similar problem which i had solved it by just compiling the indicator under vista. i had trouble mt4 finding this indicator itself. i tried various method's methods including turning virtualization off, that helped a bit though.

I know you have had wasted so much time fixing this on vista, if you can just give the source out so ppl compile on their computers, if not just you can try distributing the file complied on vista.

and let us know if it works.

thanks
Harry
 
 
  • Post #402
  • Quote
  • Dec 1, 2011 12:35am Dec 1, 2011 12:35am
  •  hanover
  • Joined Sep 2006 | Status: ... | 8,092 Posts
Quoting harora
Disliked
Hi David, ......
Ignored
Harry,

Thanks for the info. It seems that the simplest solution with Vista and Win7 is to re-install MT4 somewhere else, other than under Program Files. More info here.

David
 
 
  • Post #403
  • Quote
  • Dec 1, 2011 10:02am Dec 1, 2011 10:02am
  •  fxrambo
  • | Joined Sep 2009 | Status: Member | 320 Posts
Quoting hanover
Disliked
Harry,

Thanks for the info. It seems that the simplest solution with Vista and Win7 is to re-install MT4 somewhere else, other than under Program Files. More info here.

David
Ignored
ua recently indicator isd perfect i was wondering is it possible for u to make it look as the indi on subwindow on the chart attached
Attached Image (click to enlarge)
Click to Enlarge

Name: gvc.gif
Size: 33 KB
 
1
  • Post #404
  • Quote
  • Dec 1, 2011 6:08pm Dec 1, 2011 6:08pm
  •  hanover
  • Joined Sep 2006 | Status: ... | 8,092 Posts
Quoting fxrambo
Disliked
ua recently indicator isd perfect i was wondering is it possible for u to make it look as the indi on subwindow on the chart attached
Ignored
Rambo,

I wasn't planning on rewriting the display format, and I don't know how to calculate the POI trend, in any case.

I attached the source code to post #398, if anybody else wants to tackle it.

David
 
 
  • Post #405
  • Quote
  • Dec 2, 2011 1:10am Dec 2, 2011 1:10am
  •  fxrambo
  • | Joined Sep 2009 | Status: Member | 320 Posts
Quoting hanover
Disliked
Rambo,

I wasn't planning on rewriting the display format, and I don't know how to calculate the POI trend, in any case.

I attached the source code to post #398, if anybody else wants to tackle it.

David
Ignored
sorry i just wanted ua settings for recent strendth indi to display like the subwindow with no poi trend i dont hav the indi on the subwidow but if u hav it uaself it will be nice if u share
 
 
  • Post #406
  • Quote
  • Dec 5, 2011 10:15am Dec 5, 2011 10:15am
  •  dusktrader
  • | Joined Nov 2006 | Status: Member | 15 Posts
Hi David, just wanted to pop-in and say THANKS for sharing your Recent Strength indicator. This is such a great tool!

I wanted to report a possible issue that might be IBFX-specific. I am not having any problems with the indicator on my Oanda MT4, but when I go to load it on a fresh IBFX MT4 account, for some reason the indicator sets all the "colors" to Black by default. I am using a pretty standard setup with just WinXP and a preset file built by your script.

It's not a big deal ... I just set all the colors correctly and then saved it as a template so I can get them back later. But I'm unsure why this issue only happens on IBFX and not Oanda.

I'm attaching a screenshot of before and after so you can see.
Thanks

(PS: my apologies if this issue has already been brought up. I searched this thread and did not find any specifics related to this and IBFX)
Attached Images
 
 
  • Post #407
  • Quote
  • Dec 6, 2011 2:27pm Dec 6, 2011 2:27pm
  •  hanover
  • Joined Sep 2006 | Status: ... | 8,092 Posts
Quoting dusktrader
Disliked
Hi David, just wanted to pop-in and say THANKS for sharing your Recent Strength indicator. This is such a great tool!

I wanted to report a possible issue that might be IBFX-specific. I am not having any problems with the indicator on my Oanda MT4, but when I go to load it on a fresh IBFX MT4 account, for some reason the indicator sets all the "colors" to Black by default. I am using a pretty standard setup with just WinXP and a preset file built by your script.

It's not a big deal ... I just set all the colors correctly and then saved it as...
Ignored
Dusk,

The colors set on the the 'Inputs' tab (or presets/parameter file) should override those on the 'Colors' tab. I have no idea why this would work differently with IBFX, however. Except possibly that the features on their 'Link' page and mini-terminal EA might upset some aspects of MT4 operation?

Anyway, thanks for the heads-up.

David
 
 
  • Post #408
  • Quote
  • Dec 9, 2011 4:10am Dec 9, 2011 4:10am
  •  a_angmoh
  • | Joined Aug 2010 | Status: Member | 6 Posts
Hi

Very nice indicator and (I think) I understand the principal of the supply/demand being the direction and angle relationship between the currencies.

One thing I am not sure about is the separation and the center line. Do these have any effect on the analysis or is that just a function of the scaling?

Sometimes the AUD will be right at the top and pointing down and the USD might be right at the bottom and pointing up. So I am taking note of the supply/demand relationship in that they are feeding each other

So the question is would this same scenario mean anything different if the plots were closer together rather than at the extremes of the chart?

Regards, Mat
 
 
  • Post #409
  • Quote
  • Dec 9, 2011 10:21am Dec 9, 2011 10:21am
  •  hanover
  • Joined Sep 2006 | Status: ... | 8,092 Posts
Quoting a_angmoh
Disliked
Hi

Very nice indicator and (I think) I understand the principal of the supply/demand being the direction and angle relationship between the currencies.

One thing I am not sure about is the separation and the center line. Do these have any effect on the analysis or is that just a function of the scaling?

Sometimes the AUD will be right at the top and pointing down and the USD might be right at the bottom and pointing up. So I am taking note of the supply/demand relationship in that they are feeding each other

So the question...
Ignored
Mat,

It's difficult to answer your question because there are many different types of plot available, depending on how you set the parameters. The only thing that remains consistent is that lines sloping upward denote growing strength for that currency, relative to its peers; sloping downward, growing weakness. Whereas the ending value, and any crossovers, are dependent largely on the settings and the re-scaling. Because the plots are derived directly from price, they are sensitive to (and therefore just as fickle as) price changes.

The calculations are explained in post #7, and one possible way of using the indicator in post #20.

I am a programmer, not a pro trader. Benji started a thread on how he uses the indicator here.

Regards,
David
 
 
  • Post #410
  • Quote
  • Dec 10, 2011 1:46pm Dec 10, 2011 1:46pm
  •  Strategy_xy
  • | Joined Dec 2011 | Status: Member | 16 Posts
@Hanover:
First of all, your new indicator is very nice! I think it offers great additional information in combination with the Recent Strength indicator and it is a quite powerful tool.

I thought the last days about how to use it in trading. My first approach was to trade the strongest currency of the new "CSM"-indicator vs. the weakest currency and verify the trend by a look on the Recent Strength indicator. Demotrading that approach was not that successful, because if a currency has a high value at the CSM-indicator like > 8, a pullback is very probable.

Basically the calculation of the CSM-indicator is that of a Stochastic Oscillator. Looking at a chart with two Stochastic Oscillators (simulating two different TFs by setting the Stochastic indicator appropiately - for example one set at a period of "14" and the other set to a period of "70" to simulate a CSM indicator with a 14 candles lookback period of the TFs "1min" and "5min") I understood, that the pure value of the Stochastic Oscillator is not giving much information. Finding divergences on the chart of the Stochastic Oscillator is probably a more successful approach.

So, an improvement of the CSM-indicator could be to display also the older values like the "Recent Strength"-indicator does. I do not know how much time it would take you to add that to the current CSM-indicator, but it would be a great and useful enhancement.

- Strategy xy
 
 
  • Post #411
  • Quote
  • Dec 11, 2011 9:18am Dec 11, 2011 9:18am
  •  a_angmoh
  • | Joined Aug 2010 | Status: Member | 6 Posts
Quoting hanover
Disliked
Mat,

It's difficult to answer your question because there are many different types of plot available, depending on how you set the parameters. The only thing that remains consistent is that lines sloping upward denote growing strength for that currency, relative to its peers; sloping downward, growing weakness. Whereas the ending value, and any crossovers, are dependent largely on the settings and the re-scaling. Because the plots are derived directly from price, they are sensitive to (and therefore just as fickle as) price changes.

The calculations...
Ignored
Ok that's great, will keep it in mind. I’m starting to get the hang of it now

The article on “Parallel and Inverse Analysis” that you or another member put up was a very good read thx.

I read in the beginning of the thread that FXPRO had all or almost all of the 28? pairs as to give a more accurate reading with you indicator. I guess that would explain the difference between the screen captures I attached from FXPRO and FXDD (who I am using).

I don’t think there should be any issues having a demo FXPRO account just to run your indicator to give me the supply/demand and then do everything else on the FXDD. I don’t trade anything less than daily candles anyway.

Regards, Mat
Attached Image (click to enlarge)
Click to Enlarge

Name: diff.jpg
Size: 204 KB
 
1
  • Post #412
  • Quote
  • Dec 12, 2011 1:30am Dec 12, 2011 1:30am
  •  hanover
  • Joined Sep 2006 | Status: ... | 8,092 Posts
Quoting Strategy_xy
Disliked
@Hanover:
First of all, your new indicator is very nice! I think it offers great additional information in combination with the Recent Strength indicator and it is a quite powerful tool.

I thought the last days about how to use it in trading. My first approach was to trade the strongest currency of the new "CSM"-indicator vs. the weakest currency and verify the trend by a look on the Recent Strength indicator. Demotrading that approach was not that successful, because if a currency has a high value at the CSM-indicator like > 8, a pullback is...
Ignored
Hi,

Welcome to the forum.

The CSM was originally a XLS spreadsheet that used only the D1 timeframe. I converted it to MT4 as the 'Currency Strength - Giraia' indicator (see posts #51 thru #57), and then, when I had a few spare moments, turned it into a histogram, and added a multi-TF facility.

The problem with a histogram is that it's capable of showing only one discrete value, whereas a line shows a continuous stream of values. Hence I don't know how to address your request, without plotting some kind of line....... which brings us back to the original indy described in post #1.

The NumberOfCandles parameter lets you get a kind of 'weighted value' over a number of candles (see post #398 for an explanation).

I believe one way of using the histogram is to focus on (for example) the D1, and pair the strongest against the weakest. Then wait for a pullback in a short timeframe (e.g. M15) in that pair, and once the price resumes in the direction of the D1 trend, then it's time to enter your trade.

I wrote the Recent Strength indy primarily for my own use. For me, it is only the slope of the lines that has any significance.

David
 
 
  • Post #413
  • Quote
  • Edited 8:18am Dec 12, 2011 7:29am | Edited 8:18am
  •  regme
  • | Joined Mar 2010 | Status: Planning to be like Warren Buffett | 115 Posts
Respected Sir,
Thanks for nice Currency Index Reversal Indicator and your brilliant support. I understand we only check reversal expected below 2 and after 8.

Pls. forgive my ignorance. If already asked/replied.

I wish to select index to trade if its currency Index(e.g EUR) is strengthening on all selected time frames irrespective of Index position.

Q- How to find if currency Index(e.g EUR) is weakening/strengthening at current candle and current TF.? I means if it is going UP or Down?. Do we compare current candle value with previous candle value or some other method.
 
 
  • Post #414
  • Quote
  • Dec 14, 2011 7:39am Dec 14, 2011 7:39am
  •  hanover
  • Joined Sep 2006 | Status: ... | 8,092 Posts
Quoting regme
Disliked
Respected Sir,
Thanks for nice Currency Index Reversal Indicator and your brilliant support. I understand we only check reversal expected below 2 and after 8.

Pls. forgive my ignorance. If already asked/replied.

I wish to select index to trade if its currency Index(e.g EUR) is strengthening on all selected time frames irrespective of Index position.

Q- How to find if currency Index(e.g EUR) is weakening/strengthening at current candle and current TF.? I means if it is going UP or Down?. Do we compare current candle value with previous candle...
Ignored
Hi,

Sorry, I only noticed your post now. I don't subscribe to threads.

I assume you're referring to the CSM indy in post #398. It performs the calculation as explained in that post. It is not necessarily a currency index.

As for showing whether the last candle is up/down, we need to see the difference between the last 2 values. The problem with a histogram is that it's capable of showing only one discrete value, whereas a line shows a continuous stream of values. Hence I would suggest using the Recent Strength indy (see post #1), and comparing the line across the last 2 data points. If the line is rising then that currency is, on average against all other currencies, strengthening; if it's falling, then the currency is weakening. The Recent Strength indy's calculation is explained in post #7.

David
 
 
  • Post #415
  • Quote
  • Dec 15, 2011 3:20am Dec 15, 2011 3:20am
  •  Bakuli
  • | Joined Jul 2007 | Status: Learner | 1,363 Posts
Hi ,

I am just posting a request from a mate who is not a member yet. He is using the CFP indicator attached which does not refresh automatically. Would it be possible for anybody to re-code the indicator to make it do that automatically, instead of having to manually switch timeframes to refresh it ?
Any help would be much appreciated.

Thank you very much.

Best regards
Attached File(s)
File Type: mq4 CFP.mq4   14 KB | 861 downloads
 
 
  • Post #416
  • Quote
  • Dec 21, 2011 4:58am Dec 21, 2011 4:58am
  •  a_angmoh
  • | Joined Aug 2010 | Status: Member | 6 Posts
Hi

Just wondering after we have populated the data for all the pairs using the method described by cycling through the charts and time frames do we need to redo this each week or is once enough?


Regards, Mat
 
 
  • Post #417
  • Quote
  • Dec 22, 2011 3:18pm Dec 22, 2011 3:18pm
  •  hanover
  • Joined Sep 2006 | Status: ... | 8,092 Posts
Quoting a_angmoh
Disliked
Hi

Just wondering after we have populated the data for all the pairs using the method described by cycling through the charts and time frames do we need to redo this each week or is once enough?


Regards, Mat
Ignored
Mat,

Sorry about the belated reply, I am having internet problems.

This should be a once only process. However, if you shut down MT4 for a long time (several days, weeks), then it will likely take several minutes, when you next restart it, to 'catch up' while the RS indicator collects the data that occurred during the timeout. The more currencies and timeframes the indicator is plotting, the longer the process. If you find it taking hours rather than minutes, then it might be better to exit/restart MT4 and perform the manual cycling process again.

The same applies if you remove currencies or timeframes from the indicator, and then you reinstate them again. This would result in the same data 'catch up' process.

I wish you a happy and safe holiday and a prosperous 2012.

David
 
 
  • Post #418
  • Quote
  • Dec 22, 2011 5:50pm Dec 22, 2011 5:50pm
  •  astral77
  • | Joined Nov 2009 | Status: Member | 1,196 Posts
HI DAVID

For those who want to see the recent strength of a pair of currencies on a chart, seller9 has created an essential add on indicator for recent strength, I find it very useful because I do not need to go back to the recent strength chart to see the pairs strength, check it out here, http://www.forexfactory.com/showthre...06#post5234706
IMHO it is an essential add on for users of recent strength.

A very Merry Xmas and a prosperous new year for you and your loved ones.

Kind regards
 
 
  • Post #419
  • Quote
  • Dec 24, 2011 12:00pm Dec 24, 2011 12:00pm
  •  brucewhain
  • | Joined Aug 2006 | Status: brucewhain | 242 Posts
Today got so disgusted with Internet Explorer (It won't download from certain sites now.) that tried switching my default browser to firefox, but find you can't use favicons and my computer is nothing but folders full of folders full of favicons. Maybe they will address this sometime. (Seems Windows has disabled it somehow, since according to old posts on the internet it used to be possible.) Am however very pleased with Foxit reader and have long had certain dislike of Adobe who it seems, had it handed to them, on top of their locking up the market for commercial graphics stuff previously, based mostly on having the most unhelpful user support services possible, with a special mischievous attitude. Of course everyone knows that Windows 7 / Vista is a big step backwards. It is a constant source of annoyance. Everything in U.S. is going to the Devil.

So, if Mozilla should decide to come out with an open source operating system and it catches on, do you think you would be likely to re-write your indicators, specifically Plot_News, to run on it? (Don't know if such an operating system is feasible or likely but think they'd better do it soon, because Windows 9, according to my calculations, signals the end of the world.)

Nice picture on your user profile & was interested to learn about your keyboard hobby. Was a keyboard major in school and still manage to play a few minutes evey day, now that homelessness is for the moment out of the way.

Best Wishes for Merry Christmas and Happy New Year,

Bruce
 
 
  • Post #420
  • Quote
  • Dec 24, 2011 2:43pm Dec 24, 2011 2:43pm
  •  hanover
  • Joined Sep 2006 | Status: ... | 8,092 Posts
@astral77: many thanks for the info.

@brucewhain: both MT4 and the FFcal.EXE program run independently of any web browser (e.g. Internet Explorer or Mozilla Firefox). Agree with you about Vista and Win7, btw; both have caused headaches for me replying to the countless number of users who wonder why EAs and indicators don't work (when MT4 is installed somewhere under Program Files).

I wish everybody a safe and happy holiday and a prosperous 2012.

David
 
 
  • Platform Tech
  • /
  • Recent Strength indicator
  • Reply to Thread
    • 1 1920Page 212223 44
    • 1 20Page 2122 44
0 traders viewing now
  • More
Top of Page
  • Facebook
  • Twitter
About FF
  • Mission
  • Products
  • User Guide
  • Media Kit
  • Blog
  • Contact
FF Products
  • Forums
  • Trades
  • Calendar
  • News
  • Market
  • Brokers
  • Trade Explorer
FF Website
  • Homepage
  • Search
  • Members
  • Report a Bug
Follow FF
  • Facebook
  • Twitter

FF Sister Sites:

  • Metals Mine
  • Energy EXCH
  • Crypto Craft

Forex Factory® is a brand of Fair Economy, Inc.

Terms of Service / ©2023