• Home
  • Forums
  • Trades
  • News
  • Calendar
  • Market
  • Brokers
  • Login
  • Join
  • User/Email: Password:
  • 10:27am
Menu
  • Forums
  • Trades
  • News
  • Calendar
  • Market
  • Brokers
  • Login
  • Join
  • 10:27am
Sister Sites
  • Metals Mine
  • Energy EXCH
  • Crypto Craft

Options

Bookmark Thread

First Page First Unread Last Page Last Post

Print Thread

Similar Threads

M candles / Custom candles for second charts 0 replies

Recent Candles - modification needed 0 replies

Calculating only buy candles vs sell candles 2 replies

count candles indicator 3 replies

Moving Average Indicator that removes Sunday Candles? 1 reply

  • Platform Tech
  • /
  • Reply to Thread
  • Subscribe
  • 66
Attachments: Recent Candles indicator
Exit Attachments

Recent Candles indicator

  • Last Post
  •  
  • Page 1 23456 12
  • Page 1 234 12
  •  
  • Post #1
  • Quote
  • First Post: Edited Jan 30, 2014 2:12pm Mar 23, 2009 7:04am | Edited Jan 30, 2014 2:12pm
  •  hanover
  • Joined Sep 2006 | Status: ... | 8,090 Posts
NOTE (Jan 31, 2014): Any indicators or EAs that I've contributed to this thread will probably no longer work in the latest MT4 build that is (if I understand correctly) due to be rolled out on Feb 3. If you want to ensure that these indicators/EAs continue to work correctly, do NOT upgrade your MT4 beyond the current build (509). I don't know how to re-code them to make them run correctly in the new look MT4, and I've no desire to re-educate myself to learn the new programming language that MetaQuotes is forcing upon everybody. Personally I think that their short-sighted development policy totally stinks, but there's nothing I can do about it. So if you decide to upgrade, you're on your own. Please note the Terms and Conditions below.
______________________

TERMS AND CONDITIONS

Please note that all code in this thread is supplied FREE of charge. Therefore the following conditions apply:

1. You agree that, if you download and use the code, it is ENTIRELY AT YOUR OWN RISK. I accept NO LIABILITY for any financial losses or computer related damage, caused by either the correct or incorrect use of the code.

2. Feel welcome to share the code freely, and modify any MQ4 source. However, you may NOT sell, or otherwise distribute, any part of the code commercially, without my prior written consent.

3. The code may not run correctly on Windows 7, Windows 8 or Vista, probably for the reasons given here.

4. I'm sorry, but due to my current work commitments, I am no longer modifying code to suit people’s personal requirements, nor posting replies to individual questions in this thread. (If you can’t get the code to work, you may find solutions already posted somewhere in the thread; otherwise, you’ll need to find another indicator).

_______________________

INSTRUCTIONS

Latest update: version 1.15, uploaded February 14, 2011
Latest changes to this post in red typeface

Disclaimer: The attached indicator is supplied 'as is', free of charge. No warranty or obligation of support is implied. Download and use it at your own risk. I hope that you find it useful. It's the initial v1.0 release, please feel welcome to post questions, and report any bugs or shortcomings in this thread.

Note: "Recent Candles" now plots the candles using a histogram. The original version of the indicator is no longer supported.

Note (May 25, 2010): Please take the opportunity to download this indicator while it's still available for free. I will soon be applying to become a commercial member.
_____________________

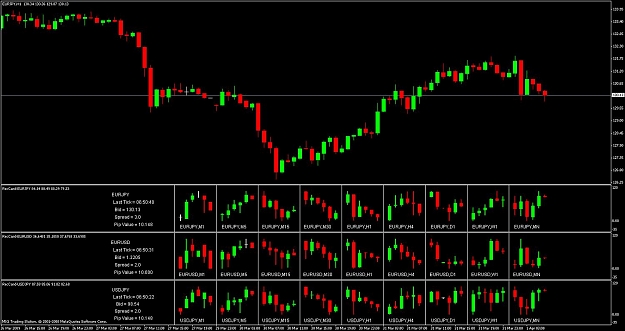
This indicator will show the most recent X candles in any pair/timeframes on your current chart. It can update itself every tick (warning: could slow computer performance), or once per candle on any timeframe that you specify. It allows you to see trend/momentum/patterns in all timeframes simultaneously, without having to move between charts, as shown in the attached screenshot. Trade with the thrust provided by the longer term trends; and/or use as a kind of 'currency strength meter' to trade with the strongest and cleanest trending pairs.

Or, if you prefer, edit the indicator and go to the 'Levels' tab. You could add levels at (for example) 25 and 75, just like with an oscillator, and then place countertrend trades when price is oversold or overbought on multiple timeframes, and/or across correlated pairs. Note that the 'indicator' values always range between 0 and 100 (just like RSI or stochastic), across all timeframes. Adjust the NumCandles parameter to plot quartile (or whatever) lines for any given number of candles.

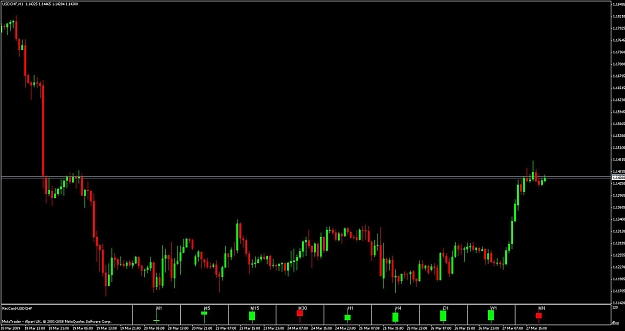
If you set the NumCandles parameter to 0, and compress the window size vertically, you effectively get a 'traffic light' indicator, that simply shows a green or red symbol, highlighting whether price is currently bullish or bearish in each timeframe.

To display different pairs all on the one chart, simply attach the indicator multiple times (see the screenshot).

To invert the process (i.e. pairs in the one sub-window, a separate sub-window for each timeframe), attach multiple occurrences of the indicator, each for a single timeframe and the same group of currency pairs (see post #46 for screenshot). Or attach one occurrence of the indicator, with multiple pairs, but leave the timeframe blank; then switch timeframes on the chart to show the candles for all pairs, for the selected timeframe.

To install, copy the attached Presets---Recent Candles.TXT file into the ...../experts/files folder; copy the attached Recent Candles.ex4 file into the ...../experts/indicators folder, and then restart MT4. Press Ctrl-N to open the Navigator, and drag the indicator (under the 'Custom Indicators' tree) onto your chart. Set the parameters to suit (see the 'PARAMETERS' section below), and click OK.

You can set the parameters either by using MT4's built-in dialog, when you attach the indicator; or by overriding these settings using the Presets---Recent Candles.TXT file (use a text editor like Notepad to view/edit the file). Using the file allows you to save preset values, retaining them for each future time you attach the indicator. To disable an entry in the file, start the line with two slashes (//). To re-enable it, remove the slashes. You may use any number of embedded spaces or underscores, and/or any combo of upper or lower case, to aid readability, however you wish. Every line MUST end with a semi-colon (; ). To save typing and improve accuracy, copy/paste the sample lines in the file. To disable the entire file, rename it, or delete its content; if the file doesn't exist, the Parameter Dialog entries (when you attach/edit the indicator) will be used. To have any changes take immediate effect, either (1) re-attach the indicator to your chart; (2) edit the indicator (press Ctrl-I); or (3) toggle between timeframes.

To expand/compress the plot(s) horizontally, zoom in/out using the +/– keys.
To expand/compress the plot(s) vertically, drag the window separator upward/downward.


PARAMETERS

  1. CurrencyPairs - leave blank to default to the current chart's pair. Otherwise type in up to 30 pairs (e.g. GBPUSD or simply GU), separated by commas. Pairs will display in the left-to-right order in which you type them. Spaces are optional, and may be included for clarity. Upper/lowercase may be used interchangeably (e.g. USDCHF or usdchf). Permissible abbreviations are: A=AUD; C=CAD; E=EUR; F=CHF; G=GBP; J=JPY; N=NZD; U=USD; H=HKD; S=SGD; Z=ZAR. So you could type gj instead of GBPJPY, for example. If the pair name typed is not exactly 2 characters, the abbreviation will not be recognized. You can type a valid pair symbol followed by an asterisk (*), to have its inverted pair's candles plotted, e.g. typing AU* will plot USDAUD instead of AUDUSD candles.
  2. TimeFrames - select the timeframes you wish to see, separated by commas. If displaying only one timeframe, a trailing comma is not required. Leaving this parameter blank defaults to the timeframe of the chart to which the indicator is attached. The spaces are optional, and are included merely for clarity. Upper/lowercase may be used interchangeably (e.g. H1 or h1). Time frames will display in the left-to-right order in which you type them
  3. NumCandles - how many candles back from the currently forming one, that you want to see. For example, to see the currently forming candle, and also the last 3 candles, type 3. Typing 0 (or leave blank) causes only the currently forming candle to display, creating a 'traffic light' indicator. Typing a single value will display that number of candles for all timeframes. Typing multiple values, separated by commas, allows a different number of candles for each timeframe (by matching the NumCandles entry with the corresponding TimeFrames entry)
  4. HistoricalShift – enter 0 to display the current plot. Enter a positive number to display the plot as it would have looked X candles ago. Typing a single value will display that HistoricalShift for all timeframes. Typing multiple values, separated by commas, allows a different HistoricalShift for each timeframe (by matching the HistoricalShift entry with the corresponding TimeFrames entry). This will likely be necessary, e.g. to see the candles as they were 4 hours ago, you'd need to type 1,4,8,16,48 for the H4,H1,M30,M15,M5 timeframes, respectively
  5. CandleWidth - set to a value between 2 and 5. Default is 5. A higher value means wider candle bodies. Experiment until you find a value that suits
  6. SpacingBetweenCandles - set to 1, 2 or 3. Higher number means wider spacing between candles, and is preferable when the main chart is 'zoomed out' to smaller candles. Experiment until you find a value that suits
  7. Colors, TextColor/Font/Size should be self-explanatory
  8. DisplayInfo - if set to TRUE, this will display the last Bid/Ask price, Tick time, Long/short swap rates, Spread (and spread as a % of average daily move) and Pip Value (dollar value your acount will change per pip, for each full lot traded) at the left of the window
  9. DisplayCcyName - if set to TRUE, <pair> will be included in the labels displayed along the bottom of the window
  10. DisplayTF - if set to TRUE, <timeframe> will be included in the labels displayed along the bottom of the window
  11. RefreshEveryXMins - if set to 0, this will cause the window to update itself immediately a new tick occurs. If set to 1, 5, 15, 30, 60, or 240, this will cause the window to update itself every time a new candle appears on the M1, M5, M15, M30, H1 or H4 chart, respectively
  12. HeikinAshiCandles - if set to TRUE, this will plot Heikin Ashi candles, instead of conventional ones.

CHANGE HISTORY

v 1.01: fixed division by zero error, caused by zero height candle (high = low) in any timeframe. Tidied up text alignment. Added new parameters DisplayInfo and RefreshEveryXMins (see above)

v 1.02: fixed anomalies with the alignment, where a 'foreign' currency was being added to the chart. Moved and centered <pair>,<timeframe> text to bottom of window. Added new 'Last Tick' display time to Display Info. Added Parameter Settings File facility. Updated the screenshot below.

v 1.03: Enhanced DisplayInfo options. Parameter entry (CurrencyPair, TimeFrames) is now more lenient.

v 1.04: Text font/size now user-selectable. Can also select display of <pair>,<timeframe>, or just <timeframe>, along bottom of window. Parameter file operation upgraded to Recent Strength/Recent Prices 'technology'/mode of operation.

v 1.05: Timeframes now display, left-to-right, in the order you type them. Can now have a different number of candles for each timeframe.

v 1.06: Can now display candles for up to 30 pairs x all 9 timeframes, or any subset/combo thereof, all across the same sub-window. New parameters DisplayTF (replaces DisplayTFOnly) and DisplayCcyName.

v 1.07: Added HistoricalShift parameter.

v 1.08: Fixed bug in 'Spread' info display. It now displays the correct percent figure (spread as a % of avg daily move) for brokers with 5/3 decimal places in their quotes.

v 1.09: (Hopefully) fixed bug described in post #81.

v 1.12:
1. Fixed "ArrayInitialize function internal error" bug reported in post #104.
2. Added inverted pairs facility, e.g. can now plot USDGBP candles from GBPUSD data. See CurrencyPairs in PARAMETERS section above, for details.
3. Should now work correctly for GBPUSDm pairs, provided that the full symbol (GBPUSDm) is typed into the CurrencyPairs parameter instead of the abbreviation (GU).
4. Included a zip file of templates (see post #108 for screenshot).

v 1.13:
1. Fixed bug reported in post #110.

v 1.14:
1. New parameter CandleWidth addresses request in post #123.

v 1.15:
1. New parameter HeikinAshiCandles allows plotting of Heikin Ashi candles instead.


___________________________

MT4 Indicators/EAs by Hanover:

Recent Strength — display line-based plot of weighted average of currency (as opposed to pair) strength
Recent Prices — display line-based plots of any combo of pairs/timeframes on your current chart, to compare their relative strength
Recent Candles — display candles of any combo of pairs/timeframes on your current chart
Recent SR — auto-plot horizontal support/resistance lines based on a wide variety of settings
Recent News — display upcoming and/or historical news announcements from FF calendar; countdown/alert upcoming announcements
Daily Lines/Boxes — auto-plot horizontal or vertical lines, boxes, symbols on user-defined times, days of the week, etc
Display Info all pairs — display spread, daily range, dollars/pip, swap rates etc for all pairs
Spaced Lines — auto-plot horizontal lines on your charts
Stealth Master EA — hide your SL and TP from unscrupulous br0kers!
Do-it-yourself alerts builder kit — code template that you can copy/paste that will add pop-up and/or e-mail alerts to most 'standard' indicators

Attached Image (click to enlarge)
Click to Enlarge

Name: recent candles screenshot 3.jpg
Size: 130 KB
Attached Files
File Type: zip Recent Candles templates.zip   31 KB | 14,676 downloads | Uploaded May 23, 2010 4:26pm
File Type: ex4 Recent Candles.ex4   36 KB | 14,535 downloads | Uploaded Feb 13, 2011 11:23pm
File Type: txt Presets---Recent Candles.TXT   < 1 KB | 9,239 downloads | Uploaded Feb 13, 2011 11:23pm
File Type: mq4 Recent Candles.mq4   37 KB | 14,479 downloads | Uploaded Aug 25, 2012 6:07am
  • Post #2
  • Quote
  • Mar 23, 2009 7:49am Mar 23, 2009 7:49am
  •  ahbinn
  • | Joined Feb 2009 | Status: Member | 29 Posts
it doesn't seem to be aligning nicely as shown in your screenshot. any settings that will fix it ?
 
 
  • Post #3
  • Quote
  • Mar 23, 2009 8:01am Mar 23, 2009 8:01am
  •  hanover
  • Joined Sep 2006 | Status: ... | 8,090 Posts
Quoting ahbinn
Disliked
it doesn't seem to be aligning nicely as shown in your screenshot. any settings that will fix it ?
Ignored
What exactly is not aligning? What are your settings? Please post a screenshot illustrating the problem.
 
1
  • Post #4
  • Quote
  • Mar 23, 2009 8:26am Mar 23, 2009 8:26am
  •  magnumfreak
  • Joined Nov 2007 | Status: Trying manual mode again | 2,210 Posts
Quoting hanover
Disliked
What exactly is not aligning? What are your settings? Please post a screenshot illustrating the problem.
Ignored
most likely due to a screen resolution difference.

great job on the indicator BTW
 
 
  • Post #5
  • Quote
  • Mar 23, 2009 3:28pm Mar 23, 2009 3:28pm
  •  hanover
  • Joined Sep 2006 | Status: ... | 8,090 Posts
Just uploaded a new version. Makes better use of vertical screen space, and also reduces the number of objects drawn by 33% (by combining the upper and lower wicks into a single line).

Still haven't fixed the glitch I mentioned, though. I'd ask for help, but I'm not allowed to post the source code.
 
 
  • Post #6
  • Quote
  • Mar 23, 2009 4:22pm Mar 23, 2009 4:22pm
  •  Money4Nothing
  • | Additional Username | Joined Dec 2006 | 531 Posts
Try this template.
Attached File
File Type: tpl recent_candles.tpl   98 KB | 4,334 downloads
TRO
 
 
  • Post #7
  • Quote
  • Edited at 6:52pm Mar 23, 2009 6:39pm | Edited at 6:52pm
  •  kd3726
  • | Joined Feb 2009 | Status: Member | 121 Posts
Quote
Disliked
There's one small glitch that I'm still working on. The indicator doesn't automatically display when initially dragged onto the chart. You have to toggle between timeframes to have it kick-start itself.
Comment out any start() command in init() function.

Create the objects once in your start() procedure.
as opposed to creating them in init().


Add something like this to start()
and before the objects are referenced...
--------------------------------


if (ObjectsCreated==False)
{

for ( i=0; i<=30; i++ )
{

MyObject[i]=("MyObject"+i);

if (ObjectFind(MyObject)>0) ObjectDelete(MyObject);

if(!ObjectCreate(MyObject[i], OBJ_LABEL,WindowFind("MY_INDICATORS_SHORTNAME"), 0, 0))
{
Print("MyObject Error - Code #",GetLastError());
return(0);
}else{
ObjectSetText(MyObject[i],"-",FontSize, "Tahoma");

ObjectSet(MyObject[i], OBJPROP_COLOR, Silver);
ObjectSet(MyObject[i], OBJPROP_XDISTANCE, (10));
ObjectSet(MyObject[i], OBJPROP_YDISTANCE, (10*i));
Print("MyObject Instance Created:"+MyObject[i]);
}

} // end create

ObjectsCreated=True;

} // end if not created


then add something like this in deinit()
---------------------------------------------------

for ( i=0;i<=30;i++ )
{

MyObject[i]=("MyObject"+i);

if(ObjectDelete(MyObject[i]))
{
Print("MyObject Removed:"+MyObject[i]);
}else{
Print("MyObject:"+MyObject[i]+" Object Removal Error - Code # ",GetLastError());
}

}

---------------------------------------------------------

You'll neeed a bool ObjectsCreated global to do it this way.
set ObjectsCreated=False in init()

The objects should appear right away. hope that helps...

btw... great indi work!


  • Post #8
  • Quote
  • Edited at 9:14pm Mar 23, 2009 8:19pm | Edited at 9:14pm
  •  hanover
  • Joined Sep 2006 | Status: ... | 8,090 Posts
Quoting kd3726
Disliked
Comment out any start() command in init() function.
Ignored
Thanks for your help, I will give it a try.

BTW, there was no calling of start() from init()
I was calling a procedure plot_objects() from both start() and init()

[EDIT]
Problem fixed. It was a careless error. I was using a variable window number, and setting it only in init()
When I set it in plot_objects() instead, all works correctly.

Thanks again for your help.

I have just uploaded the latest version.
 
 
  • Post #9
  • Quote
  • Mar 23, 2009 10:25pm Mar 23, 2009 10:25pm
  •  cobraforex
  • Joined Aug 2008 | Status: Sharpen the Scalper Razor | 4,704 Posts
Another great job on this indicator, congrats and thanks, David.

Now if Mrs. Cobra asks why I need another additional monitor I will give the fault to you
 
 
  • Post #10
  • Quote
  • Mar 23, 2009 10:58pm Mar 23, 2009 10:58pm
  •  hanover
  • Joined Sep 2006 | Status: ... | 8,090 Posts
Quoting cobraforex
Disliked
.........Now if Mrs. Cobra asks why I need another additional monitor I will give the fault to you
Ignored
Just send me the bill, Cobra. Mrs Hanover's next pair of designer sunglasses will have to wait, LOL.
 
 
  • Post #11
  • Quote
  • Mar 24, 2009 3:34pm Mar 24, 2009 3:34pm
  •  hanover
  • Joined Sep 2006 | Status: ... | 8,090 Posts
Vesrion 1.01 is now available - see post #1 for details, and to download.
 
 
  • Post #12
  • Quote
  • Mar 27, 2009 4:01pm Mar 27, 2009 4:01pm
  •  supremeChaos
  • Joined Feb 2009 | Status: Borderline yahoo & oh-no! | 6,607 Posts
Quote
Disliked
Another great job on this indicator, congrats and thanks, David.
Now if Mrs. Cobra asks why I need another additional monitor I will give the fault to you


Hmmmmmm... indeed, does seem to warrant a new monitor
pretty sure i thought about this in the past, but i'm not as programming-savvy... good thing, it seems like "what people need/want, hanover unconsciously creates"!! Great job, Thanks
 
 
  • Post #13
  • Quote
  • Mar 28, 2009 2:30am Mar 28, 2009 2:30am
  •  hanover
  • Joined Sep 2006 | Status: ... | 8,090 Posts
Quoting supremeChaos
Disliked
Hmmmmmm... indeed, does seem to warrant a new monitor
Ignored
If you're using the indicator to check the PA in the immediately higher timeframes, you can probably downsize to 3-4 candles in each of the next 2-3 higher timeframes. The screenshot in post #1 was merely designed to show the fullest possible capability.

For example, I trade the H1, and I find the H4 and D1 give me enough info re the next higher trend. Timeframes lower than H1 are irrelevant to me. Hence my 22-inch monitor (from which the screenshot was taken) is more than adequate.

Taking this further, there are 'traffic light' indicators available that summarize activity into each higher time frame into one symbol. You can make Recent Candles do the same by setting its NumCandles parameter to 0. See attached screenshot. (Recent Candles extends the 'taffic light' concept by allowing (i) multiple candles in each timeframe, and (ii) attaching multiple occurrences of the indicator to allow direct comparison of different pairs).

I can't squeeze the candles any more tightly together, because MT4 only allows rectangle edges to be drawn at candle midpoints (wicks) on the main chart. So I need 4 main chart candles (1 for the left hand candle edge, 1 for the wick, 1 for the right hand edge, and 1 to allow a space between adjacent candles) for each candle on the sub-chart. You can press the '-' key to zoom out, making the candles on the sub-chart(s) thinner.
Attached Image (click to enlarge)
Click to Enlarge

Name: recent candles screenshot 2.jpg
Size: 78 KB
 
 
  • Post #14
  • Quote
  • Mar 28, 2009 3:08pm Mar 28, 2009 3:08pm
  •  ha-pattern
  • Joined Sep 2008 | Status: hardcore chartist | 2,173 Posts
Thanks for the indicator.
It's good for a break, while trading 1' patterns-- one symbol, 50 bars a scale (one scale a page) , preset scales -- Drawing all over each one (except horizontal line.) http://s5.tinypic.com/2w40d4n.jpg
 
 
  • Post #15
  • Quote
  • Mar 30, 2009 1:49am Mar 30, 2009 1:49am
  •  supremeChaos
  • Joined Feb 2009 | Status: Borderline yahoo & oh-no! | 6,607 Posts
Quoting hanover
Disliked
If you're using the indicator to check the PA in the immediately higher timeframes, you can probably downsize to 3-4 candles in each of the next 2-3 higher timeframes. The screenshot in post #1 was merely designed to show the fullest possible capability....
Ignored


hanover,
u have been generously very helpful.. Appreciate that a lot.
But i think your indicator is so good & beautiful it really warrants a separate monitor, as i want, as u've said, "to show the fullest possible capability".

Will try to get that new monitor hopefully soon & check this indicator's potential out...
 
 
  • Post #16
  • Quote
  • Edited at 1:11pm Mar 30, 2009 10:51am | Edited at 1:11pm
  •  hanover
  • Joined Sep 2006 | Status: ... | 8,090 Posts
Before anybody rushes out and buys a new monitor..........

Quoting hanover
Disliked
..........I can't squeeze the candles any more tightly together, because MT4 only allows rectangle edges to be drawn at candle midpoints (wicks) on the main chart. So I need 4 main chart candles (1 for the left hand candle edge, 1 for the wick, 1 for the right hand edge, and 1 to allow a space between adjacent candles) for each candle on the sub-chart...........
Ignored
I just realized that there's possibly a more efficient way of drawing this indicator. Instead of plotting objects (rectangles) in the sub-chart window, it could plot a histogram. This could also potentially get around the problem of needing 4 candles in the main chart to plot a single candle in the sub-chart.

Leave this with me for a few hours, and I'll see what I can come up with.
 
 
  • Post #17
  • Quote
  • Mar 30, 2009 1:10pm Mar 30, 2009 1:10pm
  •  hanover
  • Joined Sep 2006 | Status: ... | 8,090 Posts
OK, I've rewritten much of the code, so that the candles plot as histograms instead of rectangles. The histogram version runs more effciently, improving computer performance, and also uses less screen width, especially when the main chart is 'zoomed in' to larger candles.

Try it and see what you think.
 
 
  • Post #18
  • Quote
  • Mar 30, 2009 6:47pm Mar 30, 2009 6:47pm
  •  dgrs
  • | Joined Jun 2007 | Status: Member | 92 Posts
Quoting hanover
Disliked
OK, I've rewritten much of the code, so that the candles plot as histograms instead of rectangles. The histogram version runs more effciently, improving computer performance, and also uses less screen width, especially when the main chart is 'zoomed in' to larger candles.

Try it and see what you think.
Ignored
I think this will be THE most and best indicator I've ever found! Monitoring different candles for entries exits when combined with trend lines and forks is the trading I am trying to 'master'. This will help me in so many ways. You are a star!

One very small suggestion - is there any chance of removing the info in the top left hand corner of the indicator window? I'm thinking particularly on the RecentCandle-Hist - if you're zoomed in quite a bit the text can get in the way.

But thank you SO MUCH.

Dave
 
 
  • Post #19
  • Quote
  • Mar 30, 2009 11:57pm Mar 30, 2009 11:57pm
  •  supremeChaos
  • Joined Feb 2009 | Status: Borderline yahoo & oh-no! | 6,607 Posts
Quote
Disliked
Before anybody rushes out and buys a new monitor..........

U've made a revision.... ALREADY??!
Look at that.... A big concern for small traders like me who plans to buy another monitor....
Truly a genuine concern....


Quote
Disliked
...The histogram version runs more efficiently, improving computer performance, and also uses less screen width....
Truly excellent!!! YOU are an in FF....
 
 
  • Post #20
  • Quote
  • Mar 31, 2009 4:39am Mar 31, 2009 4:39am
  •  hanover
  • Joined Sep 2006 | Status: ... | 8,090 Posts
Quoting dgrs
Disliked
One very small suggestion - is there any chance of removing the info in the top left hand corner of the indicator window? I'm thinking particularly on the RecentCandle-Hist - if you're zoomed in quite a bit the text can get in the way.
Ignored
I agree, it's a real nuisance. If there is a way of removing it, I will do so in the next release. As an interim workaround, edit the indicator, and on the 'Common' tab, increase the 'Fixed maximum' value from 120 to 135. This will cause the text to 'float' above the pair/timeframe headers.

I'm glad that you find the indicator useful.
 
 
  • Platform Tech
  • /
  • Recent Candles indicator
  • Reply to Thread
    • Page 1 23456 12
    • Page 1 234 12
0 traders viewing now
  • More
Top of Page
  • Facebook
  • Twitter
About FF
  • Mission
  • Products
  • User Guide
  • Media Kit
  • Blog
  • Contact
FF Products
  • Forums
  • Trades
  • Calendar
  • News
  • Market
  • Brokers
  • Trade Explorer
FF Website
  • Homepage
  • Search
  • Members
  • Report a Bug
Follow FF
  • Facebook
  • Twitter

FF Sister Sites:

  • Metals Mine
  • Energy EXCH
  • Crypto Craft

Forex Factory® is a brand of Fair Economy, Inc.

Terms of Service / ©2022