Recent Strength indicator: Terms and Conditions
All code is supplied FREE of charge. It may NOT be sold or distributed commercially. Unless otherwise shown, source code is not available.
Software is offered on an 'as is' basis. I'm not offering a programming or troubleshooting service.
There is no guarantee that the software is fit for purpose, or free of errors. Download and use the indicator(s) at your own risk; I accept no liability for computer damage or financial losses.
___________________________
The Recent Strength indicator was written and compiled using MT4 build 509. Some of the settings may not work exactly as described in build 600 or later. As explained below, the indicator requires a lot of computer resource, and it may take a long time for MT4 to load enough data to get it to plot correctly. If you're having problems running the indicator — the data plots are not appearing after several minutes — then you may find a solution in one of these posts: #70, #72, #81, #97, #116, #129. Otherwise, you'll need to find a different strength indicator**, or change to a different br0ker (there are more than 200 MT4 br0kers listed here).
** If you can't get the Recent Strength indicator to work (it can be difficult to set it up correctly), then perhaps try some of these:
CCFp (see here here and here). Several recent versions here.
FerruFX has developed an extremely versatile strength meter here.
There's a mix of line based strength indys, and histograms, in this thread.
There's also a line based strength indicator here ("2. Currency Slope Strength").
FiatFap has developed an amazing tool here, that includes a strength indicator (see post #4 for a screenshot).
Kang Gun has also developed a RSI-based strength plot. Try this post as a starting point.
More strength indicators and info in this thread, and even more by honestknave (and others) in this thread.
More strength dashboards, by GVC and others, in this thread.
Another currency meter (shows intraday strength/weakness) shared by Erebus here (and more links in the three posts following).....
.....and its big brother, the ProfitSupreme Meter, posted by jegas here.
CSW daily basket indicator here.
Strength indicator by Rafei here.
Pair Strength Analyzer here.
Latest version of CSM here; 'Currency strength - Giraia' here; RSI based strength indicator and dashboard here.
Beyond MT4 indicators:
Oanda's strength heatmap here.
Finviz futures charts show currency strength at a glance (here). (also, click on chart to see COT data).
Another futures/COT alternative here (there are both free and commercial options on the same page).
MATAF currency index here.
'Currency quake' strength meter (8 majors, 28 pairs) here.
Strength plot of 8 majors here.
Or if, after reading this, you still believe that spending money will buy you a higher quality product, here are some you might like to try:
News profiteer (Henry Liu's strength meter is apparently free, but it's a vendor-like sales page; see also video here)
Apollo by Mark Boardman
Accustrength by Tom Yeomans
PointZero (Arturo Perez is a very good programmer, IMHO)
Pitview strength heatmap
Bernhard's MT4-based strength (and related) indicators
_______________________
INSTRUCTIONS
Latest update: version 1.09, uploaded July 17, 2010
Latest changes to this post in red typeface
Disclaimer: The attached indicator is supplied 'as is', free of charge. No warranty or obligation of support is implied. Download and use it at your own risk. I hope that you find it useful. It's the initial v1.0 release, please feel welcome to post questions, and report any bugs or shortcomings in this thread.
Attention programmers: it's now possible to use values from the Recent Strength plots in your EAs. For info on how to interface Recent Strength to an EA, see here.
Note: if you want the RS alerts indy, download and unzip RSsetup.zip and run RSsetup.exe. Provided that you select the 'Destination folder' as your br0ker's MT4 folder, the setup program will install ALL of the files needed to run Recent Strength in the correct folders. Then simply restart MT4 and you're good to go. For more info on RS alerts, please read post #323.
_____________________
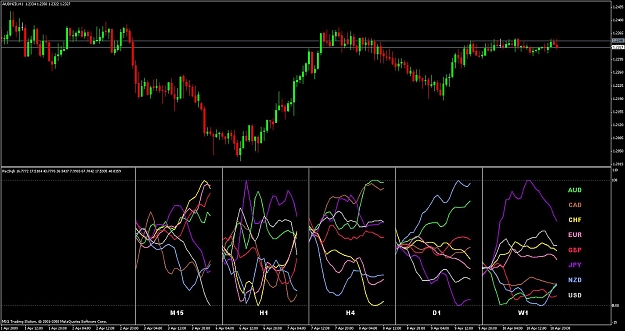
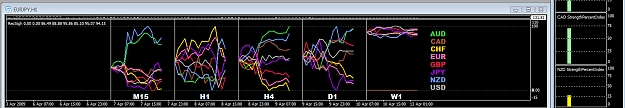
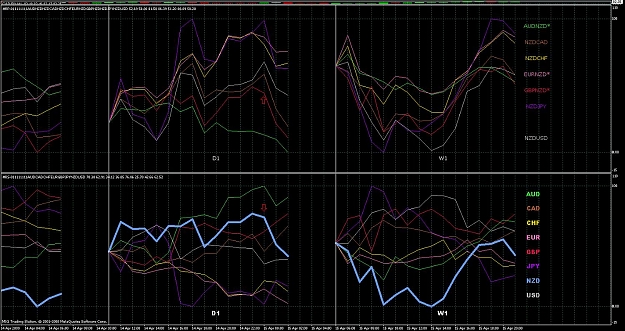
Originally designed as a companion to the Recent Candles indicator, the Recent Strength indicator plots the relative strengths of each currency against each other, on any timeframe(s) that you choose. Each colored line represents the strength of a currency averaged across (potentially) all of the related pairs offered by your MT4 broker. You can use it to (1) trade the strongest, or most rapidly strengthening currency/ies, against the weakest ones; (2) establish which currency is 'driving' a pair (e.g. if GBPUSD is rising, ascertain whether it's because GBP is strengthening, USD is weakening, or both); and (3) observe correlations between currencies (e.g. ascertain the extent to which currencies move in unison, or whether certain currencies tend to lead/lag each other). For more information, please see posts #20 and #59 below.
The indicator can potentially be used as an adjunct to any trading system, helping you decide which pair(s) to concentrate your trading on. The screenshot below (settings: NumPoints = 25, SmoothingSMA = 3) illustrates how you could have maximized profit across the D1 timeframe recently, by simply trading the NZDJPY long, without any other TA. The W1 plot shows how JPY switched dramatically from being the strongest currency to the weakest currency (falling most strongly at the right of the plot). Read 'The calculation works....' paragraph below, experiment with the settings, form your own conclusions, and use the indicator however you see fit.
To install, copy the attached Presets---Recent Strength.TXT file into the ...../experts/files folder; copy the attached Recent Strength.ex4 file into the ...../experts/indicators folder, and then restart MT4. Press Ctrl-N to open the Navigator, and drag the indicator (under the 'Custom Indicators' tree) onto your chart. Set the parameters to suit (see the 'PARAMETERS' section below), and click OK.
You can set the parameters either by using MT4's built-in dialog, when you attach the indicator; or by overriding these settings using the Presets---Recent Strength.TXT file (use a text editor like Notepad to view/edit the file). Using the file allows you to save preset values, retaining them for each future time you attach the indicator. To disable an entry in the file, start the line with two slashes (//). To re-enable it, remove the slashes. You may use any number of embedded spaces or underscores, and/or any combo of upper or lower case, to aid readability, however you wish. Every line MUST end with a semi-colon (; ). To save typing and improve accuracy, copy/paste the sample lines in the file. To disable the entire file, rename it, or delete its content; if the file doesn't exist, the Parameter Dialog entries (when you attach/edit the indicator) will be used. To have any changes take immediate effect, either (1) re-attach the indicator to your chart; (2) edit the indicator (press Ctrl-I); or (3) toggle between timeframes.
To expand/compress the plot(s) horizontally, zoom in/out using the +/– keys.
To expand/compress the plot(s) vertically, drag the window separator upward/downward.
The calculation works as follows. Each colored line represents a given currency (see legend at right of chart). Take AUD as an example. Each 'constituent' AUD-based pair that you specify (and that is offered by your broker) – e.g. AUDCAD, AUDCHF, etc – has its closing price on each candle, expressed as a ratio of the closing price of the initial candle plotted (or the BasePoint candle, if specified), and multiplied by the weight you enter (see the 'PARAMETERS' section below for more info on weights). These values are all added together, and the total divided by the total of all the weights. The pair of the parent chart (the chart to which the indicator is attached) is used to align candle times of the constituent pairs, to help work around the potential problem of missing data. If a currency is 'inverted' (e.g. GBPAUD instead of AUDJPY), then the reciprocal (1/n) is summed, so that an upward plot will always indicate a strengthening AUD, and a downward plot a weakening AUD. If the SmoothingSMA parameter (see below) is set to a value > 1, then additional prior points are used to smooth the initial values being plotted. Finally the values are then re-scaled to a value between 0 and 100 (relative to ALL values being plotted in a given timeframe). See post #7 for more information.
Note that the accuracy of the plots is restricted to the pairs, and the data (on each pair/timeframe), provided by your broker. More pairs will result in a more comprehensive plot. Missing data will result in an inaccurate curve being plotted. Use MT4's history center (press F2) and/or temporarily view charts of constituent pairs/timeframes (use the PageUp key to add more data to the left of the chart) to gather more data for plotting. Amongst MT4 brokers, www.migfx.com is one candidate whose MT4 provides ALL possible 28 pair combos involving the major currencies (AUD, CAD, CHF, EUR, GBP, JPY, NZD, USD) from which to gather data (this is not necessarily an endorsement to trade with them, though).
Note that it might take 15-30 minutes to build the plots from your br0ker's servers. This is because the indicator must download and process data from up to 9 timeframes of each of 28 different currency pairs. This process needs to occur only once. If you want to ensure that all of the necessary data is loaded from your br0ker's servers, do the following**:
Load a new chart with no indys attached, and press the minus key to zoom out as far as possible. Then open the Market Watch window (press Ctrl-M) and drag the first pair onto the chart, i.e. changing the chart to that pair. Then cycle thru each timeframe (M1, M5, .... MN), and for each timframe hold the PageUp key down for a few seconds until the price window is full of candle data. Then repeat the whole process 28 times by dragging every one of the 28 pairs onto the chart, and loading data for each timeframe. (That means that you force MT4 to load data for each of 9 timeframes x 28 pairs = 252 times). The whole job took me about 10 minutes, a one-time setup process, i.e. once all the data has been loaded, the indy itself won't ever need to retrieve it from the servers. It ensures that the indy has plenty of data to work with, on all pairs and all timeframes, right from the outset.
[** Note: there is now an application (macro) that performs this task automatically]
PARAMETERS
- ParameterFile - if left blank, the parameter file Presets---Recent Strength.TXT will be used. Settings in this file will override those entered in the dialog window when the indicator is attached/edited. If you enter a value (e.g. XXX), then the parameter file Presets---Recent Strength.XXX will be used instead. This makes it easy to switch between a number of different settings. All parameter files must reside in the ....../experts/files folder. More info here
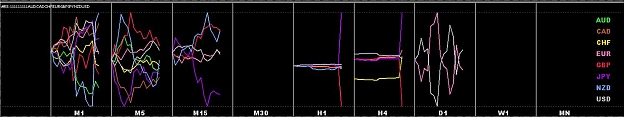
- TimeFrames - select the timeframes you wish to see, separated by commas. If displaying only one timeframe, a trailing comma is not required. Leaving this parameter blank defaults to the timeframe of the chart to which the indicator is attached. The spaces are optional, and are included merely for clarity. Upper/lowercase may be used interchangeably (e.g. H1 or h1). Time frames will display in the left-to-right order in which you type them. See note below on computer performance
- NumPoints – how many points (candles) back from the currently forming one, that you want to see. For example, to see the currently forming data point, and also the last 3 points, type 3. Typing a single value will display that number of candles for all timeframes. Typing multiple values, separated by commas, allows a different number of candles for each timeframe (by matching the NumPoints entry with the corresponding TimeFrames entry). The above creates a rolling window of the last 'n' candles. Alternatively, you can specify a fixed starting point, and thus have a progressively growing window of data points. To achieve this, enter the starting point in any of these forms: (1) YYYY.MM.DD HH:MM or (2) YYYY.MM.DD (this assumes starting from MT4 midnight at the specified date) or (3) HH:MM (this will start from the specified MT4 time, today, after it has been reached) or (4) any of these timeframes M5, M15, M30, H1, H4, D1, W1, MN (this will create a window that exists for the life of the timeframe, and then restarts over again, on the first tick of the next occurrence of that timeframe). As with the number of candles, you may specify a different starting point for each timeframe
- BasePoint – the 'anchor' point used as a reference, from which all ratios are calculated, counting back from the rightmost candle. A negative value means that BasePoint will be set equal to NumPoints, i.e. the leftmost point is also the base point. A zero value means that the rightmost point is the base point. Typing a single value will display that BasePoint for all timeframes. Typing multiple values, separated by commas, allows a different BasePoint for each timeframe (by matching the BasePoint entry with the corresponding TimeFrames entry). See the illustrative example screenshots below
- HistoricalShift – enter 0 to display the current plot. Enter a positive number to display the plot as it would have looked X points (candles) ago. Typing a single value will display that HistoricalShift for all timeframes. Typing multiple values, separated by commas, allows a different HistoricalShift for each timeframe (by matching the HistoricalShift entry with the corresponding TimeFrames entry). This will likely be necessary, e.g. to see the plots as they were 4 hours ago, you'd need to type 1,4,8,16,48 for the H4,H1,M30,M15,M5 timeframes, respectively
- SmoothingSMA – applies a simple moving average (SMA) to smooth the data being plotted. Default value of 1 effectively means no smoothing. The larger the value, the greater the smoothness (and the clearer the view), but the greater the lag. Applies to all selected currencies and timeframes. The sum of NumPoints + SmoothingSMA must NOT exceed 2,000
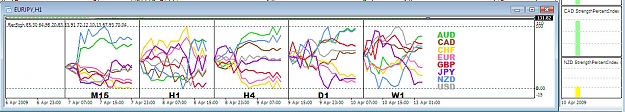
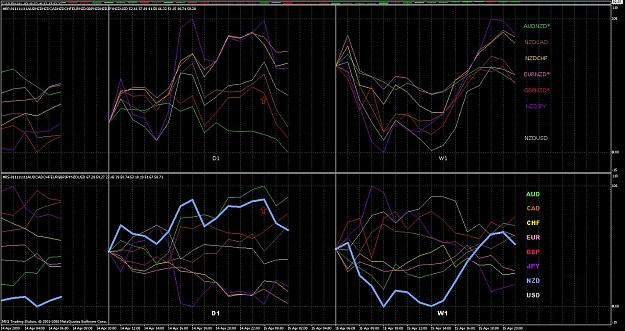
- SetBaseCurrency – leave blank for a 'normal' plot. Otherwise, type in the symbol of one of the currencies plotted, to have that currency's plot appear as a horizontal line (zero point), and all of the other currencies' plots re-scaled relative to that currency. In typing the symbol, upper/lowercase may be used interchangeably (e.g. USD or usd). Permissible abbreviations are: A=AUD; C=CAD; E=EUR; F=CHF; G=GBP; J=JPY; N=NZD; U=USD; H=HKD; S=SGD; Z=ZAR. So you could type G or g instead of GBP, for example. If the currency name typed is not exactly 1 character, the abbreviation will not be recognized
- UseTickvolForWgt – if set to FALSE, this will cause the weights in the Cn_Pairs_Wgts to be used, to weight the plot according to each constituent pair. If set to TRUE, the tick volume for each constituent pair will be summed across the points that are being plotted, and this value will override the Cn_Pairs_Wgts value
- ShowPointCount – if set to TRUE, displays a counter above the plot, showing the number of candles from the BasePoint. If set to FALSE, the date/time of each data point will be displayed instead
- LegendValues – if non-blank, this will display the numeric values of all plots at the specified data point, in all timeframes (0 is the most recent point, 1 the second most recent, and so on leftwards; -1 means the leftmost point). To have the list ranked from the lowest to highest value, or highest to lowest, include an (upper or lowercase) A or D, for an ascending or descending sort by value
- LegendVertSpacing – a lower number means that the items will be squashed closer together vertically; a higher number widens the spacing between them. You can also include any of (upper or lowercase) T, B, L, or R, to have the legend display at the top, bottom, left or right of each timeframe window. Items are color-coded to match their respective plots. The TextFont and TextSize parameters determine the font that will be used
- Text Color/Font/Size – should be self-explanatory. Font name must be spelled correctly for Windows to recognize it. Color must be spelled correctly, but may contain embedded spaces, and upper/lower case may be used interchangeably. Colors in the parameter file may alternatively be entered in R###G###B### format, e.g. b255r255 will produce magenta
- RefreshEveryXMins – if set to 0, this will cause the window to update itself immediately a new tick occurs. If set to 1, 5, 15, 30, 60, or 240, this will cause the window to update itself immediately a new candle appears on the 'parent' pair's chart (the chart to which the indicator is attached). See note below on computer performance
- OutputFile – if left blank, no output occurs. Otherwise, typing in the name of the file here will cause CSV output of all values plotted to be exported to the file name that you specify, in folder ...../experts/files, every time the indicator refreshes. The content of this file could then be imported by an EA, or by an application like Excel, for use in further analysis
- CurrencyN – the currency you want plotted in buffer# N. MT4 allows a max of 8 buffers, conveniently allowing all 8 major currencies to plot on the same chart. To disable a currency from being plotted, set this entry to blank. In typing the symbol, upper/lowercase may be used interchangeably (e.g. USD or usd). Permissible abbreviations are: A=AUD; C=CAD; E=EUR; F=CHF; G=GBP; J=JPY; N=NZD; U=USD; H=HKD; S=SGD; Z=ZAR. So you could type G or g instead of GBP, for example. If the currency name typed is not exactly 1 character, the abbreviation will not be recognized. Reducing the currencies plotted to only those that you're interested in, makes the tangled mess more easily viewable

- Cn_Color, Cn_Style – the color and style for each plot. Color must be spelled correctly, but may contain embedded spaces, and upper/lower case may be used interchangeably. Valid values for style are: 10 = solid line of width 1; 11 = dashed line; 12 = dotted line; 13 = dash-dot; 14 = dash-dot-dot; 20, 30, 40, 50 = solid line of width 2, 3, 4, 5 respectively
- Cn_Pairs_Wgts – a list of the constituent pairs that will be summed to form the plot of a given currency, and the weight attached to each. A maximum of 20 pairs/weights may be included. The format MUST be <pair1>,<weight1>,<pair2>,<weight2>, etc, with ALL commas correctly in place. The entry may optionally be ended with a final comma. Embedded spaces may be used to aid readability. Pair IDs that are mis-spelled, spelled 'backward' (e.g. USDGBP instead of GBPUSD), or are otherwise not provided or recognized by your broker's MT4, will be ignored. However, upper/lowercase may be used interchangeably (e.g. USDCHF or usdchf), and you may also use the following abbreviations: A=AUD; C=CAD; E=EUR; F=CHF; G=GBP; J=JPY; N=NZD; U=USD; H=HKD; S=SGD; Z=ZAR. So you could type GJ or gj instead of GBPJPY, for example. If the currency name typed is not exactly 2 characters, the abbreviation will not be recognized. A weight of 100 is 'normal'. To have a constituent pair contribute twice its own weight to the line being plotted, enter 200 after the pair name; 75% of its own weight, enter 75; and so on. To have a pair omitted from consideration, either set its weight to 0, or remove it from the list. Trimming the list of constituent pairs to only those offered by your broker, will improve computer performance (see note below)
- Cn_ScaleFactor – default values are 100, which mean that the indicator works exactly as before. Use this parameter to re-scale the currency's plot, aligning it more accurately with actual pip movement, as opposed to a percent average. A value of 200 would double the width of a plot, relative to the other currencies' plots; a value of 50 would halve it; and so on
COMPUTER PERFORMANCE
This indicator has the potential to slow your MT4 down dramatically, since it must gather data from several constituent pairs, and timeframes, to create the plotted curves. If performance becomes unacceptably slow, try the following –
- attach the indicator to one chart only
- avoid setting RefreshEveryXMins to 0. A value of 1 or 5 will ensure that the charts are only re-checked once every 1, or 5, minutes respectively
- reduce the number of timeframes being plotted, i.e. the TimeFrames parameter
- trim the list of constituent pairs to only those offered by your MT4 broker
AUTOMATED PARAMETER FILE BUILD
The Build Strength Preset File.MQ4 script can be used to automatically build your parameter file (Presets---Recent Strength.TXT).
Please note that this is a script, NOT an indicator, and should therefore be downloaded into folder ...../experts/scripts.
The parameter settings should be fairly self-explanatory. You can experiment and check the output, and then re-run the script as many times as necessary (the specified parameter file gets overwritten each time), until you get something that looks right. The key parameters are:
Currencies – the first eight of these become the eight colored lines on the chart. They are also used to find every combination of these that are being offered by your broker, to build the Cn_Pairs_Wgts parameter automatically, which is the major time saving that this script provides.
PairSuffix – your entry is appended to each pair, to make the pairs compatible with the symbols used by your broker. Some brokers (IBFX is an example) offer mini accounts where the pair is suffixed by an 'm', e.g. GBPJPYm instead of GBPJPY. Hence you would type m into this parameter. Some bokers (e.g. Latitude FX) append a period (.) after the pair names, e.g. GBPJPY. instead of GBPJPY. So you would type . into this parameter. And so on.
The Weight value is included multiple times across every Cn_Pairs_Wgts parameter. If you want to assign different weights, you'll need to adjust the values in the parameter file manually (use a text editor like Notepad).
The Colors, Styles, and Scale Factors correspond with their respective Currencies entries, and should likewise be separated by commas. Of course you can always edit these manually, also.
All of the other parameters (TimeFrames onward) can either be set here, or edited manually later.
CHANGE HISTORY
v 1.00: Initial release.
v 1.01: Fixed bugs described in post #9. Added BasePoint parameter.
v 1.02: Added ShowPointCount parameter (see post #17 for screenshot). Increased max NumPoints+SmoothingSMA value from 200 to 500.
v 1.03: Added Cn_ScaleFactor parameter.
v 1.04: Added UseTickvolForWgt, SetBaseCurrency and HistoricalShift parameters. Can have a different NumPoints, BasePoint, and HistoricalShift value for each timeframe. TimeFrames now display left-to-right in the order that you type them. Abbreviated currency/pair symbols (e.g. EU, GJ) can now be entered. Indicator ShortName has been abbreviated.
v 1.05: Added ParameterFile option, allowing multiple user-selectable parameter files. Date/time now displayed above each data point if ShowPointCount = FALSE
v 1.06: Added OuputFile option (see above for details)
v 1.07:
1. Fixed bug described in post #97.
2. Added Build Strength Preset File.mq4 script (see relevant section above).
v 1.08: Now displays currency names in Data Window. See notes/screenshot in post #142.
v 1.09:
1. In the parameter file, colors may now alternatively be entered in the form (e.g.) r255b0g127 i.e. specifying a red, blue and green value (0-255) for each primary color in the desired mix.
2. New parameters LegendValues and LegendVertSpacing now optionally allow a color-coded display of all plot values at any specified point, and their relevant currency, on each timeframe.
3. Instead of a rolling window of NumPoints candles, a fixed starting point may optionally be specified, for each timeframe. This means that the window will grow horizontally as more time points are progressively added. The starting point may be specified as either YYYY.MM.DD HH:MM, or as a timeframe identifier (M5, M15, etc), which means that the window will reset itself at the start of each such timeframe.
4. Increased max NumPoints+SmoothingSMA value from 500 to 2,000.
CSM and other strength indicators (written by hanover)
CSM (Currency Strength Meter) is an alternative strength indy, that plots a histogram instead of a line of continuous values.
- Latest version of CSM can be downloaded here.
- CSM calculations are explained here and here.
- J4D strength indicator, an offshoot of CSM, can be downloaded here. This uses a different set of calculations, based on weighted moving averages, to determine strength.
- Latest version of 'Currency strength - Giraia' indy can be downloaded here. More info here and here. This indy displays numeric values instead of a histogram. As the forerunner of CSM, it uses much the same calculations.
- Recent Oscillator Strength (ROS) indicator can be found here (download files plus instructions). Latest version (it now allows RSI, CCI to be plotted) available here.
- RS Alerts indicator can be found here. More info here.
- Recent Prices indicator here.
- Pair Strength Analyzer (PSA) indicator here.
Other useful posts in the thread
Post #428 — Info on Steve Hopwood's "hanover" EA that uses output from the Recent Strength indy.
Post #445, #447 — Links to how the calculations work for RS and CSM.
Posts #469, #484 — Ideas for trading approaches using currency strength.
Post #474 — Things to try if you're having trouble installing CSM.
Posts #491, #520 — Links to other strength indicators.
Post #480 — Screenshot EA. Writes snapshots of your screen every X minutes to a named series of files.