Hey guys and girls..
Just doing some random chart research using the Recent Strength indicator from Hanover. After a quick eyeball I came up with a very basic system and was just wondering if anyone had backtested it or had any ideas why it may not work. Ran 3 trades today and all 3 worked out so will continue to forward test for a while and play, but just curious whether someone has tried anything this basic using the indicator...
Pretty much just look at the daily recent strength indicator window at the beginning of a new day to see how each of the pairs has faired over the last day- choose a combination of pairs where one is strong and the other weak (one moving up the other moving down) and then simply set a trade on that pair depending on which one is stronger... Stop loss and TP are to be toyed with at the moment but will just be using recent high lows for now and maybe consider ATR percentage..
Heres my examples...
This mornings daily recent strength chart
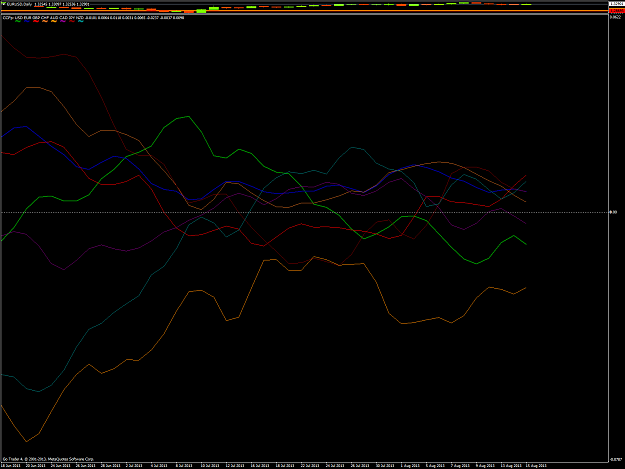
As you can see
AUD strengthened
USD weakened
NZD still strengthened
CHF weakened
GBP still strengthened
and so on ..
So from this i simply set up 3 test trades using this information at the start of the new day (took the trades just before Tokyo open but will try and be awake for Sydney next time)..
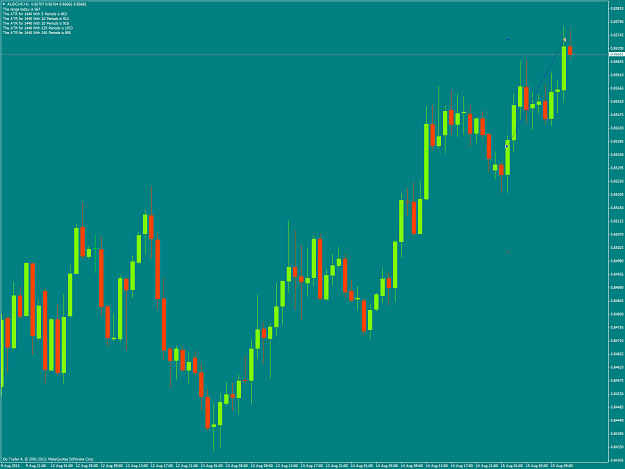
Buy AUDCHF
Buy NZDUSD

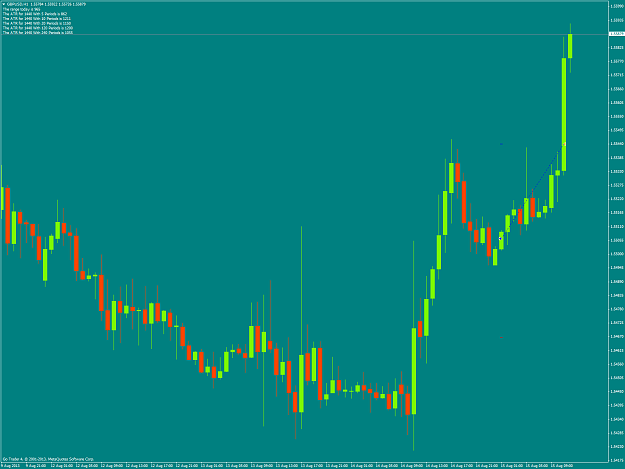
BUY GBPUSD
So thats pretty much it... Like i said its very simple but from a short visual backtest seems like it could be something worth looking at. I know some people will use this indicator in line with another system to give them a bias however just curious whether it could be used this simply.
Any critism is welcomed thats why I came here
Josh
Just doing some random chart research using the Recent Strength indicator from Hanover. After a quick eyeball I came up with a very basic system and was just wondering if anyone had backtested it or had any ideas why it may not work. Ran 3 trades today and all 3 worked out so will continue to forward test for a while and play, but just curious whether someone has tried anything this basic using the indicator...
Pretty much just look at the daily recent strength indicator window at the beginning of a new day to see how each of the pairs has faired over the last day- choose a combination of pairs where one is strong and the other weak (one moving up the other moving down) and then simply set a trade on that pair depending on which one is stronger... Stop loss and TP are to be toyed with at the moment but will just be using recent high lows for now and maybe consider ATR percentage..
Heres my examples...
This mornings daily recent strength chart
Attached Image (click to enlarge)
As you can see
AUD strengthened
USD weakened
NZD still strengthened
CHF weakened
GBP still strengthened
and so on ..
So from this i simply set up 3 test trades using this information at the start of the new day (took the trades just before Tokyo open but will try and be awake for Sydney next time)..
Buy AUDCHF
Attached Image (click to enlarge)
Buy NZDUSD
Attached Image (click to enlarge)
BUY GBPUSD
Attached Image (click to enlarge)
So thats pretty much it... Like i said its very simple but from a short visual backtest seems like it could be something worth looking at. I know some people will use this indicator in line with another system to give them a bias however just curious whether it could be used this simply.
Any critism is welcomed thats why I came here
Josh
nollej is power..