DislikedMat,
Sorry about the belated reply, I am having internet problems.
This should be a once only process. However, if you shut down MT4 for a long time (several days, weeks), then it will likely take several minutes, when you next restart it, to 'catch up' while the RS indicator collects the data that occurred during the timeout. The more currencies and timeframes the indicator is plotting, the longer the process. If you find it taking hours rather than minutes, then it might be better to exit/restart MT4 and perform the manual cycling process again.
The...Ignored
Merry Xmas too.
Yes I thought that was the case just wanted to check.
I think I am getting the hang of your indicator
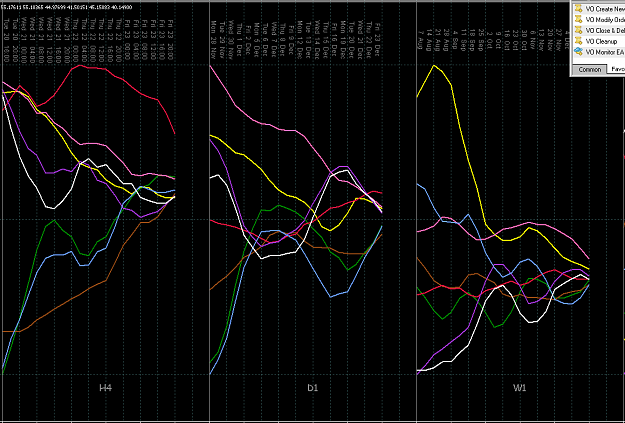
You mentioned before that you are most interested in the slope of the last two data points to give you the relationship of strength/weakness. Does that mean form the current forming data points or the last two fully completed data points? (In my case the last two fully completed days). The current forming day is always fluxing around as it receives new data.
I only trade daily charts so would it be a viable solution to look at just the daily and weekly recent strengths to give me the momentum, is there a need to look at any lower? The weekly strength/weakness confirmed with the daily strength/weakness of course with the right signal and the right area should provide for a good entry.
When I first started to use your indicator I had them all up on my screen but it became quite confusing, especially the lower time frames.
Regards, Mat