{quote} Uploaded with v7 and changed names for clarification
Ignored
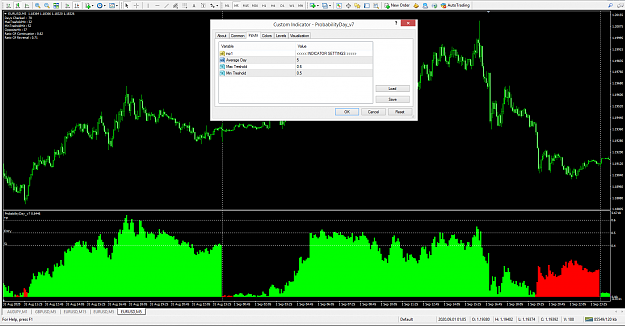
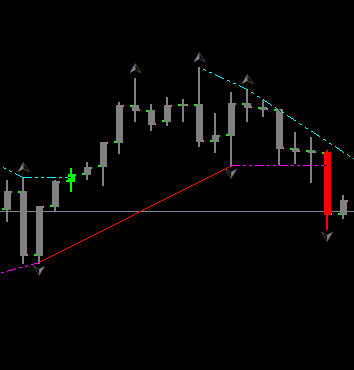
Based on my screenshot below, am I correct in assuming the following ?
Out of 70 days, at some stage 52 times price closed between 50% and 60% of the 5 day ADR (=MinThresholdHit).
Of those 52 ocurrences, price traveled to and hit the MaxThreshold (60% of the 5 day ADR) 32 times.
In 37 cases, price first closed between 50% and 60% of the 5 day ADR, to hit 40% (OppositeHit ?)
Just trying to get my head around this before running extensive tests.
Thanks in advance for clarifying.
{quote} Based on my screenshot below, am I correct in assuming the following ? Out of 70 days, at some stage 52 times price closed between 50% and 60% of the 5 day ADR (=MinThresholdHit). Of those 52 ocurrences, price traveled to and hit the MaxThreshold (60% of the 5 day ADR) 32 times. In 37 cases, price first closed between 50% and 60% of the 5 day ADR, to hit 40% (OppositeHit ?) Just trying to get my head around this before running extensive tests. Thanks in advance for clarifying. {image} LuXing
Ignored
That is correct. Without touching the opposite it reached to MAX treshold only 32 times.
So it was checking whichever touched first at candle close
{quote} That is correct. Without touching the opposite it reached to MAX treshold only 32 times. So it was checking whichever touched first at candle close
Ignored
Thanks for your quick reply.
I am especially interested in knowing if "OppositHit" in the case of the screenshot was the 0.40% boundary.
i.e. Min threshold in the indi was set to 0.50, max threshold to 0.60, would opposite in this case be the same distance as between 0.5 and 0.6, 0.40 ?
Another question, 70 days is statistically not very significant. My trading platform has M5 candles from begin May 2020, is there any way to up the number of days ?
{quote} Thanks for your quick reply. I am especially interested in knowing if "OppositHit" in the case of the screenshot was the 0.40% boundary. i.e. Min threshold in the indi was set to 0.50, max threshold to 0.60, would opposite in this case be the same distance as between 0.5 and 0.6, 0.40 ? Another question, 70 days is statistically not very significant. My trading platform has M5 candles from begin May 2020, is there any way to up the number of days ? LuXing
Ignored
Its not significant but atleast gives sense of what it been doing for past few months. It means opposite hit is close lower than %50. Doesnt guarantee that it will keep doing that as you said.
In the code i made it to check based on your bar amount on the chart. So 70 days means. Out of your all history it found only 70 cases where it matched up your rule.
If you enter 0.10 and 0.90 close probably you will have more cases.
As your trigger treshold zone very tight.
So that 70 days might found out of 300 days. Means only 70 days have found your trigger based on your rule. Have to go now , but will be back thanks for the interest.
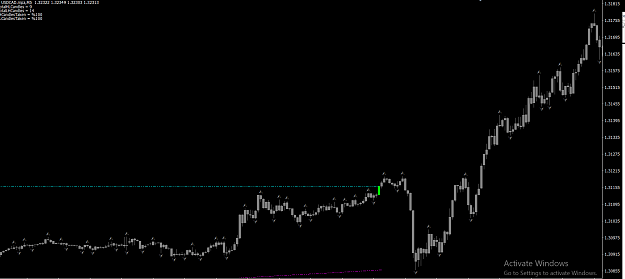
{quote} When the price hit %80 of the day it have tendency to stop. Why do i say that ? Not because of the probabilities but the psychology. There is only %20 room left for profit while it can reverse back all the way down. So its not wise, most of the time you can see it will slow down at those points. I like Nested zones to place trades. {image}
Ignored
Could you please say %80 of what? For example 1 have 1m chart, then 80% of previous day? Or what? Sorry for noob questions )
Hi Quants! Thank you for very interesting thread! {quote} Could you please say %80 of what? For example 1 have 1m chart, then 80% of previous day? Or what? Sorry for noob questions )
Hi Quants! Thank you for very interesting thread! {quote} Could you please say %80 of what? For example 1 have 1m chart, then 80% of previous day? Or what? Sorry for noob questions )
Ignored
%80 of the daily average.
If candle moves in average of 100 pips per day. When 80 pips is reached it have tendency to stop.
{quote} HI emonts, just an idea, try to use sequence number for calculation next move of the candles. there should be 2 pullback and 1 projection. the seq number is a number added from previous number starting from 0 and 1 0,1,1,2,3,5,8,13,21,34,55,89,144,233,377 calculation for every candle can be made using small number for example: if you choose 13...number 8 and 5 become pullback/retrace and number 21 become next projection. (1st cycle) next if price breaks projection number 21 next number will be 34 or 55 if price stop at 55 and do pullback/retrace...
Ignored
Hi watercooler,
how do you calulcate your horizontale line based on sequence of fibonacci ? to get it on chart and after definite swing based on them ?
thx
Joined Jun 2016
|
Status: Sharing EUR/USD Ideas and Insights
|15,528 Posts
Hi Quants, very good thread here, are you still open on requests?
If, then how many pips does the 4th 4 hour candle travel after its opening every day until it gets back to its opening again and after 10 pips move threshold.
{quote} %80 of the daily average. If candle moves in average of 100 pips per day. When 80 pips is reached it have tendency to stop.
Ignored
Thanks! Go it!
Could you please calculate the probability
Daily open is zero.
What is the probability if MA(50 for example) cross zero +0.25% and then cross +0.75% and same
if MA cross cross -0.25% and then -0.75%
If you can create this for 5 steps for example 0.25-0.5-0.75-1-1.25 (with an ability to change steps) and stats like this
0.25 - 0.5 = 85%
0.5 - 0.75 = 74%
0.75 - 1 = 43%
1 - 1.25 = 12%
--
-0.25 - -0.5 = 86%
... so just ma settings, steps and days back.
This is al very interesting but not easy.
Thank you for your teachings mr Quant.
My be i may give a suggestion.
Wood it be interesting to some stats on ZigZag and ZigZagZug. I think more special on higher timeframes?
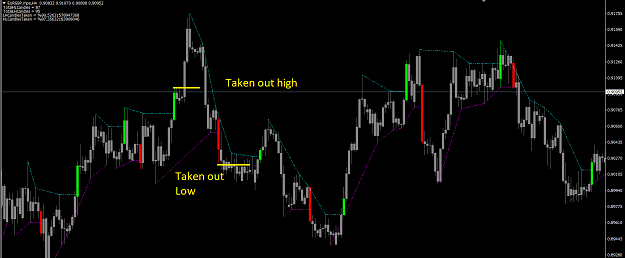
Here is the new bomb.
Once EURGBP H4 Candle breaks the higher low or Lower high
It have %90 probability that it will take out the high of the lower high breakout candle
It have %87 probability that it will take out the low of the higher low breakout candle
Here is the new bomb. Once EURGBP H4 Candle breaks the higher low or Lower high It have %90 probability that it will take out the high of the lower high breakout candle It have %87 probability that it will take out the low of the higher low breakout candle LOL {image}
Ignored
Nice insight. What's your criteria for determining the higher low and lower high?
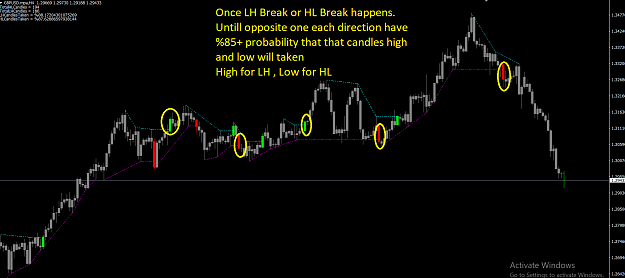
The sweet part is here.
If we go to USDCAD H4 And take Higher Low and Lower High levels.
And confirm the breakout at lower timeFrame which is M5.
Then we will see those candles high and lows was taken %100 of the time.
High for LowerHigh break
Low for Higher low break
I may add a future to check , If candles high or low was taken with atleast X pip. Without giving X pip back. So this would give me create my whole strategy with non subjective Takeprofit and stoploss
Trying to synthesize this. Are your findings showing that once a lower high has been broken before once, there is a higher probability of it being broken again in the near future?