Probability finding , Minimum movement average and Maximum movement average are my interest..
I like the idea of checking such rules. Write in simple full terms we can add it to poll for next week
This week i am adding a tool for my self which will be checking some probability using ENGULF Bars. Including max and min averages.
Keep coming the ideas eventually you gonna have more vision about the market
{quote} Nice. Thanks for that. I was allso thrown the idea if someone like to put his hands under the stone to find Max Opposite average distance that it traveled before reaching max treshold.
Eh, I dont want to do all the work by my self. However i have plans to add that one for a private version for my own use to see if its really gonna work.
I have only one question: stop loss = 1 X ATR or 2 X ATR? Basically how do we set stop loss guys? Do you focus on some levels or recent volatility is a good measure?
I have only one question: stop loss = 1 X ATR or 2 X ATR? Basically how do we set stop loss guys? Do you focus on some levels or recent volatility is a good measure?
Ignored
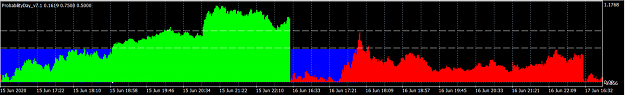
Imagine you have probability of hitting Max Treshold of the day %70 of the time. And you have %80 time that it goes the opposite.
It closed at %39 and your max hit at %45 So do you see that , You have %80 probability winner. with %6 StopLoss and %9 Take profit for that day?.
The good part is its atleast %9.. It can reverse and go all the way opposite.
Because you know, %80 Of the time it made the opposite without touching the max Treshold. This is how you take odds with you.
The other case. If you have %70 of the time Treshold is hit when it closed above %30 and reached to %45.. Here what you do, YOU Wait that it slides a bit and then fire the entry with the target of max treshold.
For those entries i told how to find stoploss. Calculate the past Opposites and find the max travel before it reached to the max. Then you will have an average stop loss and you can always enter at good entry after opposite is happened.
2 different styles. Without any filterings. With some other factors this trades can be increased so highly that you will be sniping there. Zones. That is my approach.
I wonder if the results are not biased because of this period of high volatility. this applies of course if the period tested includes a long pre and post covid period. Do you test these results before and after covid period separatly?
green pips
Bottomless wonders spring from simple rules, which are repeated without end
Thanks for this very interessant thread. I wonder if the results are not biased because of this period of high volatility. this applies of course if the period tested includes a long pre and post covid period. Do you test these results before and after covid period separatly? green pips
Ignored
The answer is no, You can run backtester for it or just try to change the code
But if you have data enough it will go back all the way before covid period. The 5 day average is found from the bar time it checks. So Average keeps changing and non covid times 5 day volatility will have less and the results will be based on that. At the end its not pips and its % of the movement so kind of normalized.
{quote} It's been a long time since I've posted here but have been watching the posts on FF now and then. Have to admit this is (I think) a very good one. I took the liberty of adjusting your indi to have an extra visual (automation) of the min and max treshold. Keep up the good work! {image} {file}
Ignored
To move forward with this it would be nice if someone can be able to code a dashboard for this to filter High % probability from low % then someone can add their own filter. I will try to ask help.
Hey guys, Im not a lot into maths and probability but done some experiments trying to find something consistent, and all i found was things that WERE consistent. Imagine you have a strategy (based on whatever) that has the returns distribution shown in the photo, and its clear that has given profit (it has had a good probability); the key points are in the red circles. The question is: Is it going to continue give profit or the 'gaps' in the red circles are going to equalize and make a perfect symmetry? For me its not obvious. I know that there many kinds of distribution shapes and i took this specific one but i hope you get the idea. Im posting this because i think it is related to what you are trying to do, and i wanted to give you a different angle (not just that it could be overfitting).
Sorry for my english.
Hey guys, Im not a lot into maths and probability but done some experiments trying to find something consistent, and all i found was things that WERE consistent. Imagine you have a strategy (based on whatever) that has the returns distribution shown in the photo, and its clear that has given profit (it has had a good probability); the key points are in the red circles. The question is: Is it going to continue give profit or the 'gaps' in the red circles are going to equalize and make a perfect symmetry? For me its not obvious. I know that there...
Ignored
Correct, Things that were consistent. Thats why once we found a good probability it never have guarantee that it will work. The questions is whether it will work for one more time. And if you have several odds at the same point. Going against it not wise but overall you can keep betting against that as you think it will go back to %50 soon and it will balanced.
{quote} Correct, Things that were consistent. Thats why once we found a good probability it never have guarantee that it will work. The questions is whether it will work for one more time. And if you have several odds at the same point. Going against it not wise but overall you can keep betting against that as you think it will go back to %50 soon and it will balanced.
Ignored
Im not saying that probabilities will retrace to 50%, if it was that way we would have a holy grail, just by doing the opposite. If you toss a coin (50/50) 1000 times and you get 1000 heads you'd still have 50% next, what you did is just found a very rare sequence. The problem here is to find a way we can be almost sure that a strategy that has been consistent is going to maintain the edge even for a little time. If things work the way you are doing then perfect (i dont know how the market really works so take my opinions as ideas if they help you), but in my little experience it hasn't work, I need a deeper research.
{quote} Im not saying that probabilities will retrace to 50%, if it was that way we would have a holy grail, just by doing the opposite. If you toss a coin (50/50) 1000 times and you get 1000 heads you'd still have 50% next, what you did is just found a very rare sequence. The problem here is to find a way we can be almost sure that a strategy that has been consistent is going to maintain the edge even for a little time. If things work the way you are doing then perfect (i dont know how the market really works so take my opinions as ideas if they...
Ignored
Well, My suggestion is following. When we have a signal. Lets put this rare sequences in our way. So we say , We believe they will work atleast for 1 more time + I have x reasons to take this trade.
So you will be picking what have been market already doing and bet that it will do that for 1 more time within your trade. The more rules you have supporting that entry more chance you have for a win.
{quote} Well, My suggestion is following. When we have a signal. Lets put this rare sequences in our way. So we say , We believe they will work atleast for 1 more time + I have x reasons to take this trade. So you will be picking what have been market already doing and bet that it will do that for 1 more time within your trade. The more rules you have supporting that entry more chance you have for a win.
Ignored
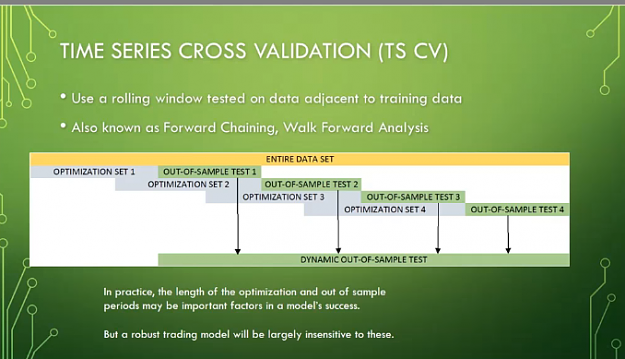
The problem still comes to the fact that you are assuming that have that edge even for the only next event. I think also that a combination of rules should be treated like a another event. Ok, since we are trying to find if the edge is going to maintain for the next event, why dont you just make probabilities of that? You take the "training period" and find the rare sequence, and then you see if the next event has mainteined the edge, and you do that across the history (kinda like a walk forward analysis). If you do that and discover an edge, we could be a little bit more confident that it is really working. Doing that we dont have to assume anything, or at least fewer things.
For the probabilityday indicator, would it be possible to figure in the "shape" of the histogram into the calculation? For example, from the start of the new day to the first minThresholdHit, to what % was the space filled by the histogram prior to that first minthreshold hit. I noticed that gradual increases to the minthreshold leads to a greater probability of the maxthreshold being hit, whereas if the histogram is far below the minthreshold, and there's a sudden spike and hit to the minthreshold, it's far more likely to result in a reversal. I think I've done a poor job at explaining so this is what I mean
Attached Image (click to enlarge)
So basically, the blue areas are of interest and are calculated as a percentage of the total area (which is only up to the first minthresholdhit), then maybe truncated to 10%, 20%, 30%, etc, intervals to make it easy, and we can investigate the probability of mintreshold hitting maxthreshold if 40% of the space was already filled by the histogram, or the probability of reversal for minthreshold if only 10% of the space was filled prior to the hit.
{quote} The problem still comes to the fact that you are assuming that have that edge even for the only next event. I think also that a combination of rules should be treated like a another event. Ok, since we are trying to find if the edge is going to maintain for the next event, why dont you just make probabilities of that? You take the "training period" and find the rare sequence, and then you see if the next event has mainteined the edge, and you do that across the history (kinda like a walk forward analysis). If you do that and discover an...
Ignored
Definitely walk forward can be the key for full automation. Especially there can be 100 rules found and even then 50 of them can fail and 50 of them can survive.
So still you don't know which rules will be the survivor ones to keep making profit.
The point comes here. If you knew for past 20 days when price reach distance of %30 from moving average and it does stop. Why you would like to go against it at 21th day.
I dont see this probabilities as holy grail. Here is the idea. If you found 100 rules that have %60 probability by looking back period 10 days. You trade 11th day. And assume they will make 1 winner trade for the signals. Some of them make some of them not. Looser ones are eleminted. You can keep the winners one or eleminate them as well. 11TH Day you can check for new 10 back period and find new 100 rules. (Previous winners will be still found and now they have more chance to be failed as they made even more consecutive wins? )
So at the end of series you will know whether your edge making sense and its working..
I dont like full automation. Its so complex for me. Definitely hard without data analysis. Machine learning needed. Strong computation is needed. Money and human power needed.
Semi auto is different thing. From my point of view. We can see what was market doing and try to bet on the rule whether its survivor or dead one.
When the price hit %80 of the day it have tendency to stop. Why do i say that ? Not because of the probabilities but the psychology. There is only %20 room left for profit while it can reverse back all the way down. So its not wise, most of the time you can see it will slow down at those points.
I like Nested zones to place trades. Tick chart moving average slopes. I calculate the speed and strength.
So those are my check points. If it moves fast enough , strong enough , if there is no wall and one of those garbage probabilities with me. I can manage that trade manually hopefully
{quote} Definitely walk forward can be the key for full automation. Especially there can be 100 rules found and even then 50 of them can fail and 50 of them can survive. So still you don't know which rules will be the survivor ones to keep making profit. The point comes here. If you knew for past 20 days when price reach distance of %30 from moving average and it does stop. Why you would like to go against it at 21th day. I dont see this probabilities as holy grail. Here is the idea. If you found 100 rules that have %60 probability by looking back...
Ignored
You'll never know what rules to trust, thats clear, but i think the chances of success depends a lot in the way we analyze things. I dont think that data analysis, machine learning and all that is needed (I use mql5 and its a pretty fast language also), the only thing that matters is what it is the most efficient way we can resolve a problem, if its needed to use more advanced tools it will come along. From my point of view the aim of maths, probability,etc is to destroy our beliefs, so we can learn and see the reality clearer. I also think that the brain and our visual capacity its way more developed that we can imagine, so if you dont have insider information or cheat in some way in forex, you'll need to see the data, and then you'll discover tons of patterns just seeing a chart even if you dont realise so I agree with you in that not all are maths. But if you study anything from the maths point of view, then youll have see what its the best way you can implement them, they're really a fantastic tool.