First page you said ''Previous week we have created Daily Average Probability checker''
So i was asking why not give the possibility to have M15 or H4 or W or M1 or... Average probability checker
I dont know if interesting but since the daily is why not
Best
{quote} First page you said ''Previous week we have created Daily Average Probability checker'' So i was asking why not give the possibility to have M15 or H4 or W or M1 or... Average probability checker I dont know if interesting but since the daily is why not Best
Ignored
Not worth. Any Timeframe lower than D1 Will not reproduce enough AVERAGE OF PIPS. So even if you have good probability that moves %10 of M15 Average candle it will only few pips. Trading opportunity cannot be created. If last 5 days average is 300 pips, It gives you enough room to get some trade within %1 or %2 moves.
But last 5 m15 candle will have so low average.
{quote} Not worth. Any Timeframe lower than D1 Will not reproduce enough AVERAGE OF PIPS. So even if you have good probability that moves %10 of M15 Average candle it will only few pips. Trading opportunity cannot be created. If last 5 days average is 300 pips, It gives you enough room to get some trade within %1 or %2 moves. But last 5 m15 candle will have so low average.
Ignored
Of course youre right but in those cases why not upper the number of candle considered ?
Btw thanks for the existing one
This thread is contuniation of the previous thread i created in platform tech. Due to thread name some requests been out of our purpose. So i had to create new thread. Explaining : You can request an idea which can return as probability. Every week i will code one winner in the Poll. This thread not to create your strategy or indicator. This Thread only to find probabilities !!! If you ask me to code an EA for you or INDICATOR you will be BANNED From the thread and ignored .. If you ask a question such as what is the probability of candle to close...
Ignored
It's been a long time since I've posted here but have been watching the posts on FF now and then.
Have to admit this is (I think) a very good one.
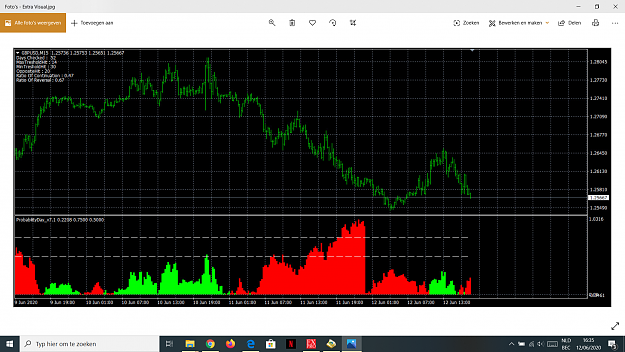
I took the liberty of adjusting your indi to have an extra visual (automation) of the min and max treshold.
Keep up the good work!
{quote} It's been a long time since I've posted here but have been watching the posts on FF now and then. Have to admit this is (I think) a very good one. I took the liberty of adjusting your indi to have an extra visual (automation) of the min and max treshold. Keep up the good work! {image} {file}
Ignored
Nice. Thanks for that.
I was allso thrown the idea if someone like to put his hands under the stone to find Max Opposite average distance that it traveled before reaching max treshold.
Is it possible to code a statistical indicator that tells me for any given period and timeframe (of my choice), how many times in percentage terms has price closed outside or inside the Bollinger band. According to bollinger price will stay inside the bands(20,2) approx 86-88% of the time if I am not mistaken.
Would be a helpful tool to determine if price is due a breakout/reversal or consolidation.
Thanks
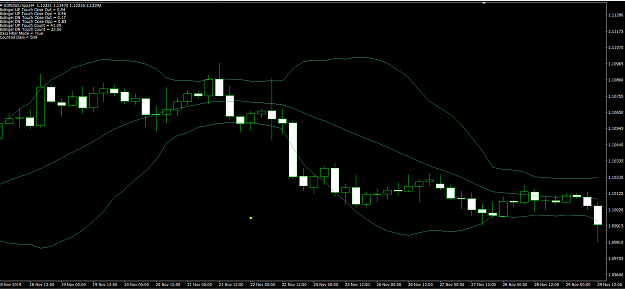
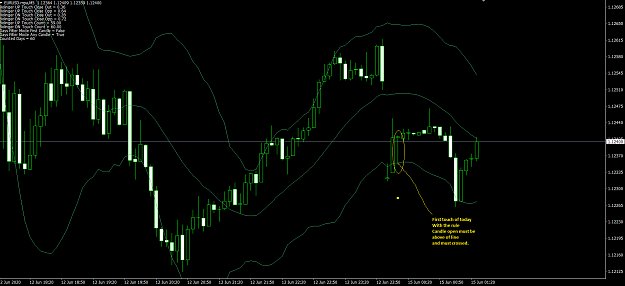
Here is this weeks answer about the bolingers. I have changed the rule a bit to make it tradeable
The rule is following : If Candle touched the Upper Bolinger Band it must opened below of the line. Then we check the probability of those candles
whether they closed above or below after the touch is initiated.
Inside of the indicator there is a option to check only first touch of the day. For Up and Dn.
This is the result as example :
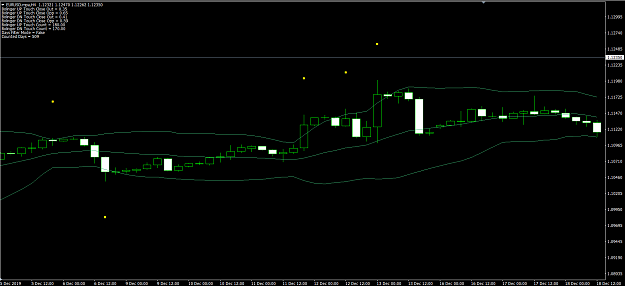
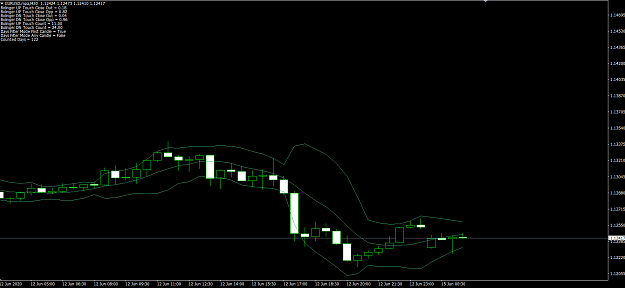
So on H4 Chart we have found
Last 509 days checked. If we go after first touch of 20 Deviation Bolinger band Lower. Then you have %83 probability that it will close above of it.
I have uploaded v3
As i added option = First Touch Of Day only First Candle means it checks touches only for 00:00 candles
The oder option is = First touch Of Day but touch can happen any candle. But must be only first touch of Up and Dn.
If Both False , It checks all bars.
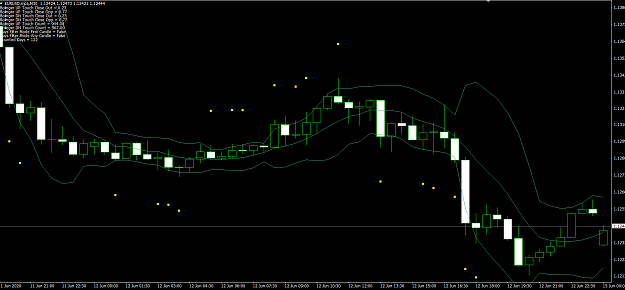
So in this screenshot Once first touch of the day happens for Upper Band , You have %65 probability that it will close OPPOSITE the bolinger band.
Remember , Candle must be opened lower than the upper line before touch happens and vice versa for Lower line.
I want to note that. As bolinger price moves if the candle makes new highs Most of the time you can get better entry points. However %65 is still good odds..
This is what have been happening for last 180 Bolinger Upper line touches on H4
You have %77 Probability for Down and UP Touches
That they will close inside of the bands.
It found the probability by looking atleast 900 touches for both directions and it been happening for past 66 days... Cool stats.
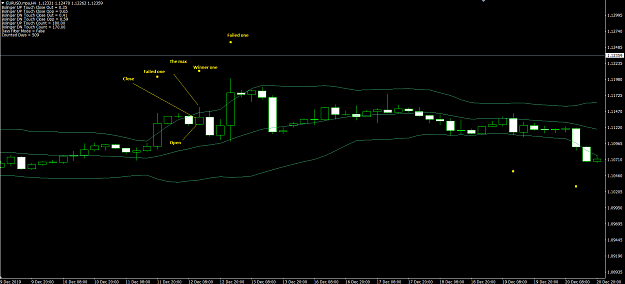
Now i am leaving another tip for whoever wants to code. If you can calculate the max distance on averarge it been traveling after the touch . You can calculate the SL and the TP to trade it. That must be counted for the same candle OR just with such rule that can give you chance to manage that trade
Attached Image (click to enlarge)
For last 122 days there have been only 24 down touches at 00:00 candle
At it have %96 probability to close opp side.
However if we get this stats for 28 pairs, It means you can get plenty of opportunities like this that been doing with super high probability. It reminds me gap closing thing. Not sure why it have such high rate like that especially for 00:00 candles.
If the New York Close price closes lower than the previous day New York Close price, the market will move down by a minimum of 42 pips on any forex pair. The reverse will also happen.
{quote}....... I was allso thrown the idea if someone like to put his hands under the stone to find Max Opposite average distance that it traveled before reaching max treshold.
If the New York Close price closes lower than the previous day New York Close price, the market will move down by a minimum of 42 pips on any forex pair. The reverse will also happen. Roy
{quote} It's been a long time since I've posted here but have been watching the posts on FF now and then. Have to admit this is (I think) a very good one. I took the liberty of adjusting your indi to have an extra visual (automation) of the min and max treshold. Keep up the good work! {image} {file}
Ignored
Maybe you could take a crack at providing a bit more of an explanation since you seem to understand what's going on better than most.