EURUSD Weekly Technical Outlook
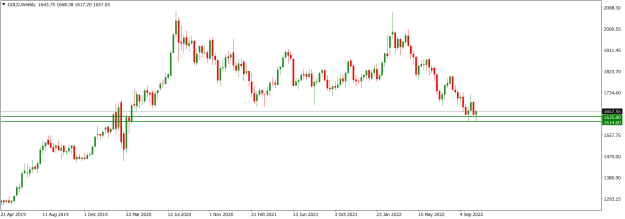
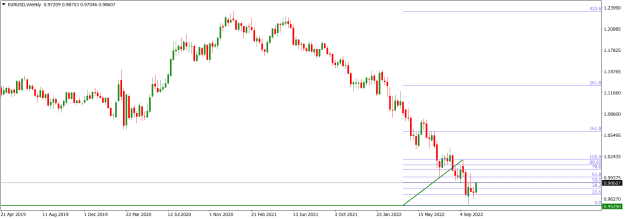
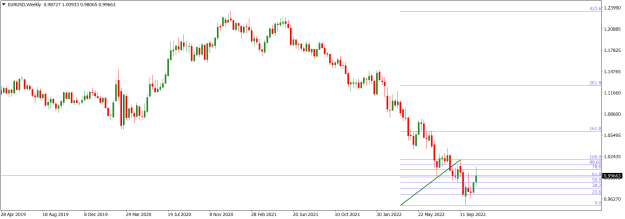
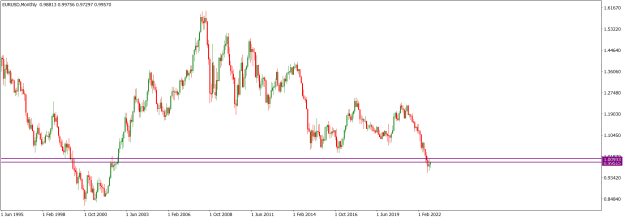
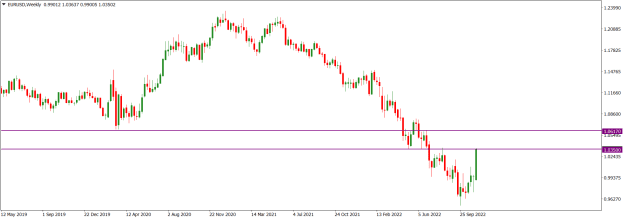
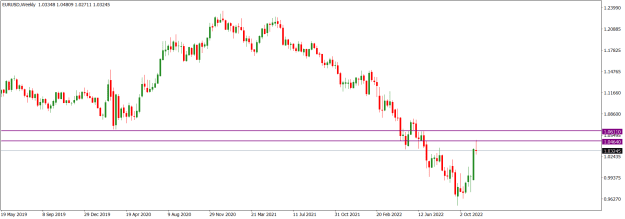
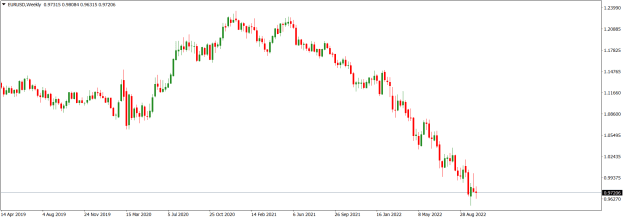
EURUSD market operation is bearish. On the weekly time frame, although last week’s market operation produced an ambivalent candlestick, the bearish pinbar printed two weeks ago portends further bearish disposition.
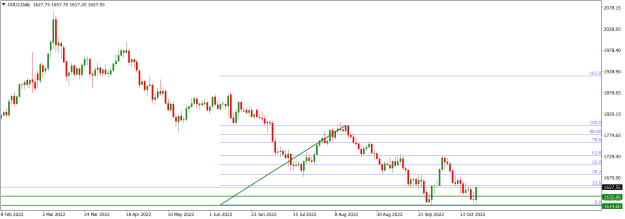
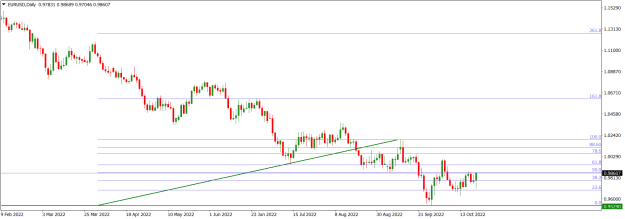
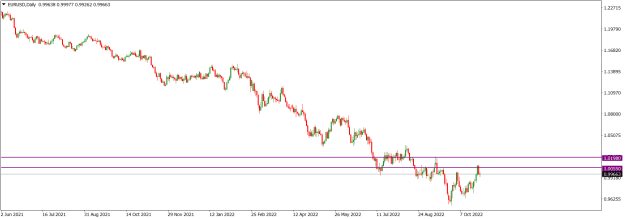
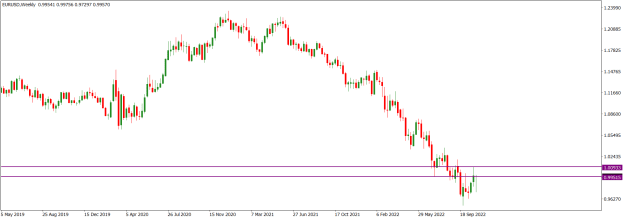
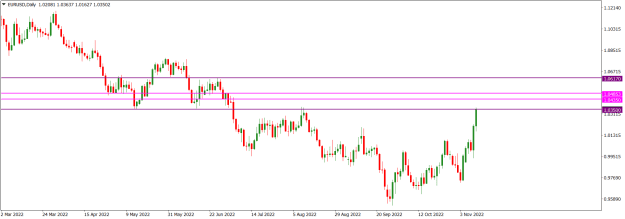
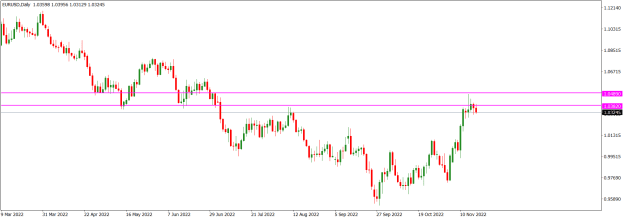
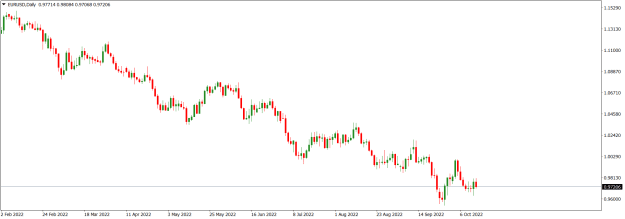
EURUSD price action on the daily time frame is presently sideways but the technical structure is bearish. Although there was a bullish correction of the recent bearish swing before price action turned sideways, further bearish move could be expected in the early part of this week.
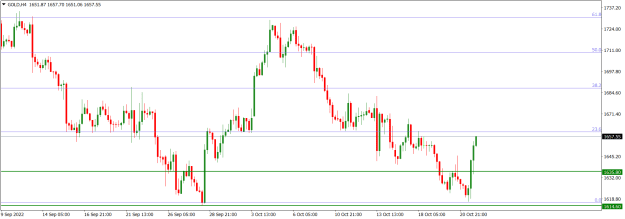
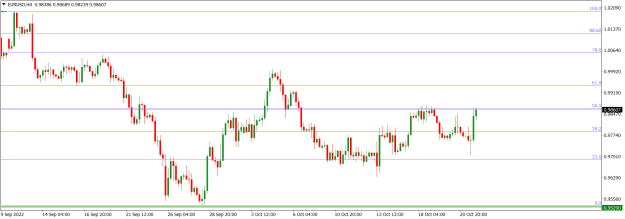
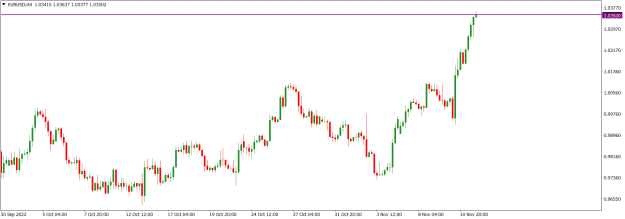
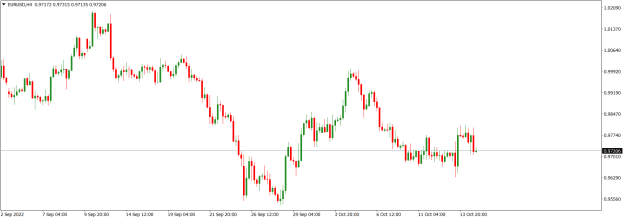
EURUSD price action on the H4 time frame is in a consolidating mode within a technically bearish structure.
I may be wrong. Trade safe and prosper.
KP
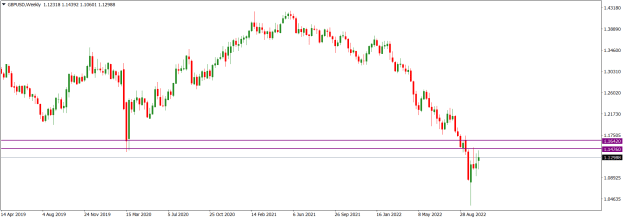
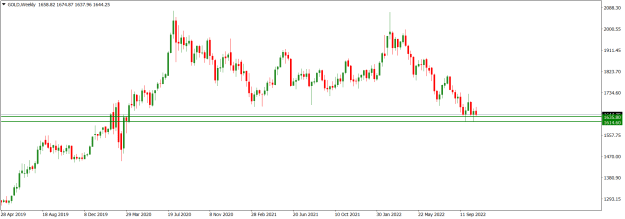
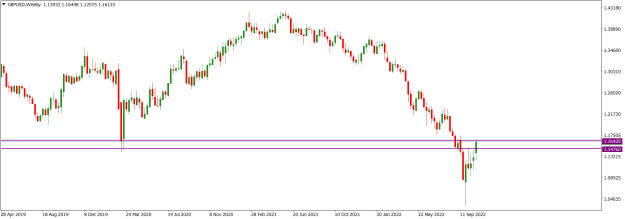
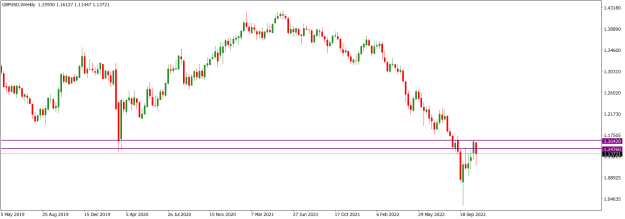
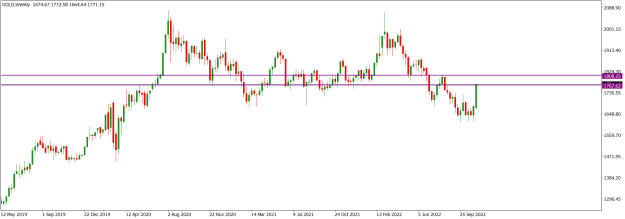
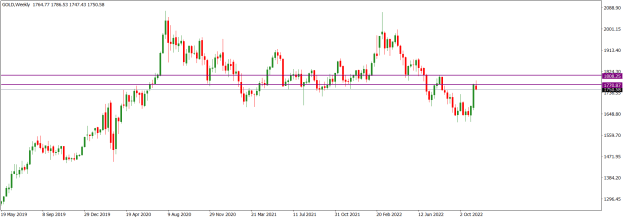
EURUSD market operation is bearish. On the weekly time frame, although last week’s market operation produced an ambivalent candlestick, the bearish pinbar printed two weeks ago portends further bearish disposition.
Attached Image (click to enlarge)
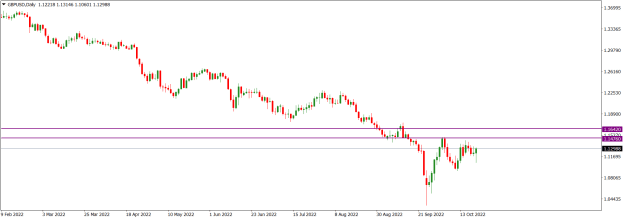
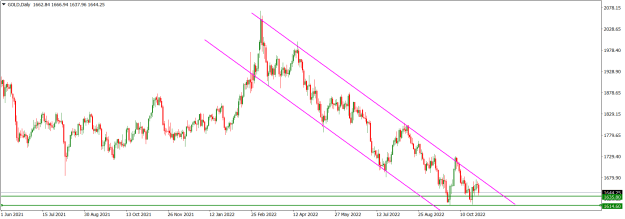
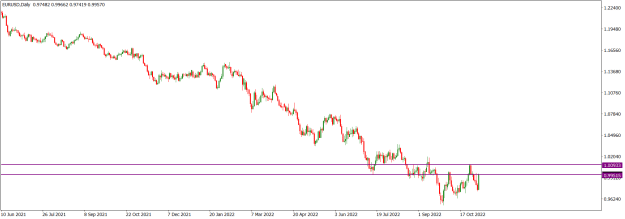
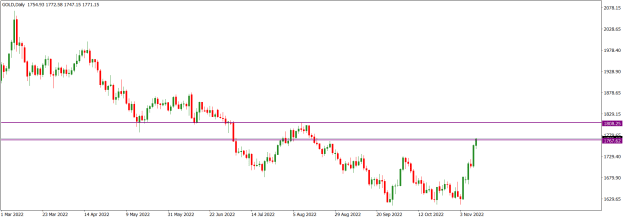
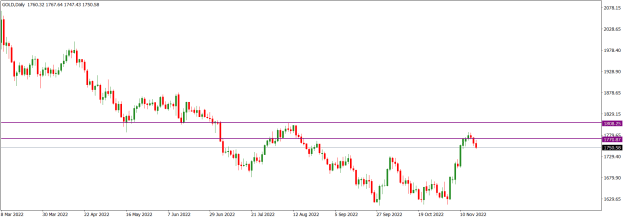
EURUSD price action on the daily time frame is presently sideways but the technical structure is bearish. Although there was a bullish correction of the recent bearish swing before price action turned sideways, further bearish move could be expected in the early part of this week.
Attached Image (click to enlarge)
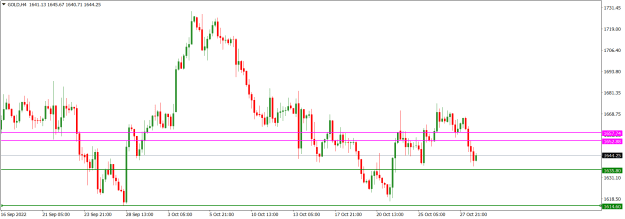
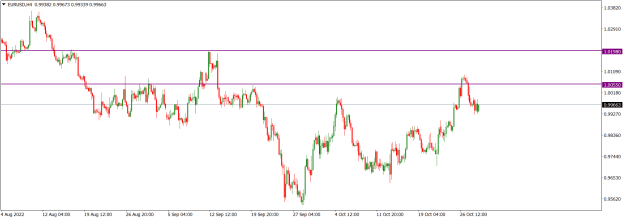
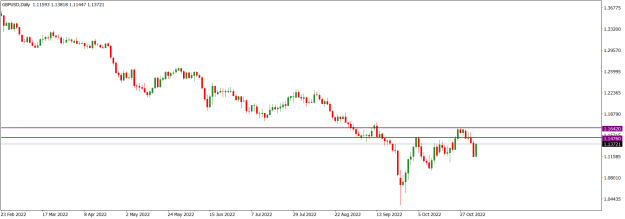
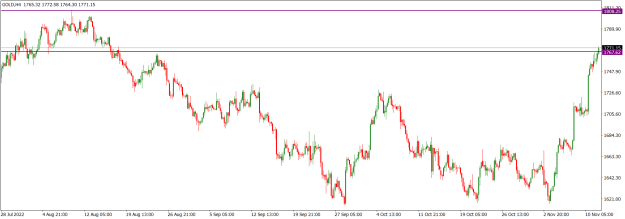
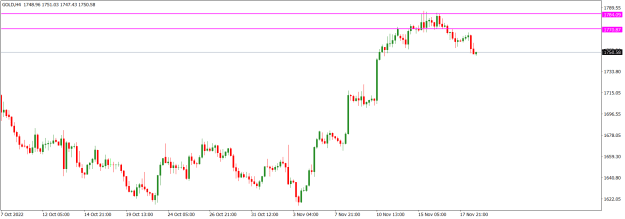
EURUSD price action on the H4 time frame is in a consolidating mode within a technically bearish structure.
Attached Image (click to enlarge)
I may be wrong. Trade safe and prosper.
KP
Do your homework, follow the footprints of smart money