• Home
  • Forums
  • Trades
  • News
  • Calendar
  • Market
  • Brokers
  • Login
  • Join
  • User/Email: Password:
  • 9:31pm
Menu
  • Forums
  • Trades
  • News
  • Calendar
  • Market
  • Brokers
  • Login
  • Join
  • 9:31pm
Sister Sites
  • Metals Mine
  • Energy EXCH
  • Crypto Craft

Options

Bookmark Thread

First Page First Unread Last Page Last Post

Print Thread

Similar Threads

Major Pairs/Crosses - Trading Scenarios, Analyses & Forecasts 15 replies

Weekly/Monthly TOP Gainers Forexfactory Traders 4 replies

Long Term Analyses - EURUSD, GOLD, and S&P 76 replies

USD/CAD - Loonie Toons, & mostly pointless analyses 2 replies

Lazy analyses thread 56 replies

  • Interactive Trading
  • /
  • Reply to Thread
  • Subscribe
  • 3,656
Attachments: Weekly Top-Down Technical Analyses
Exit Attachments
Tags: Weekly Top-Down Technical Analyses
Cancel

Weekly Top-Down Technical Analyses

  • Last Post
  •  
  • 1 7778Page 798081 84
  • 1 78Page 7980 84
  •  
  • Post #1,561
  • Quote
  • Sep 18, 2022 4:37pm Sep 18, 2022 4:37pm
  •  KeenPips
  • Joined Dec 2015 | Status: Member | 7,405 Posts
EURUSD Weekly Technical Outlook

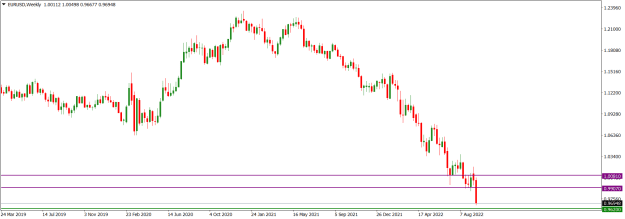
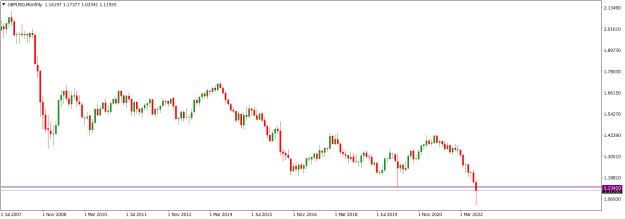
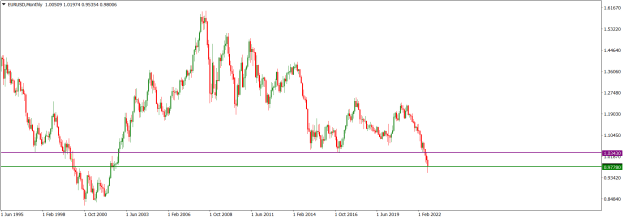
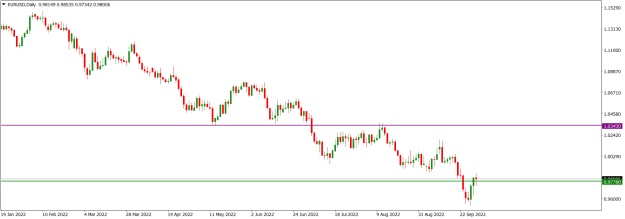
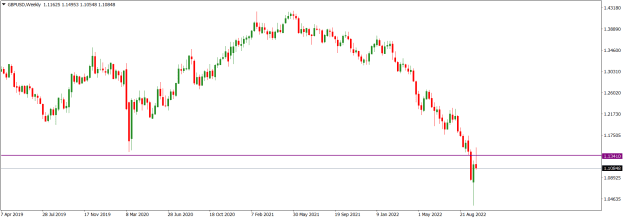
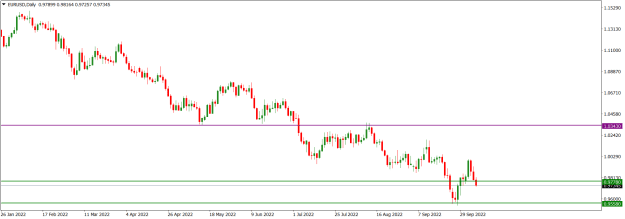
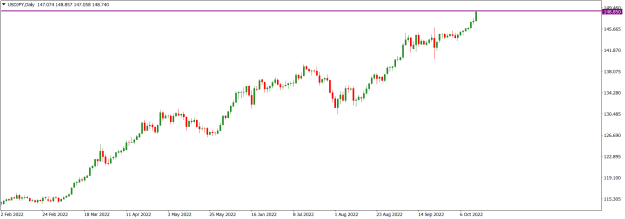
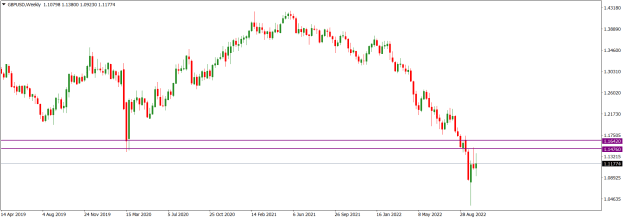
Bearish market operation dominated the EURUSD market last week, but sellers struggled to retain market influence within the 1.00810/0.99070 multi-year horizontal support zone (green). Although the printed bearish candlestick has shadows on both ends, we may still see further bearish push towards the lower part of the 1.00810/0.99070 multi-year horizontal support zone (green).

Attached Image (click to enlarge)
Click to Enlarge

Name: EURUSDWeekly_September 18, 2022.png
Size: 13 KB


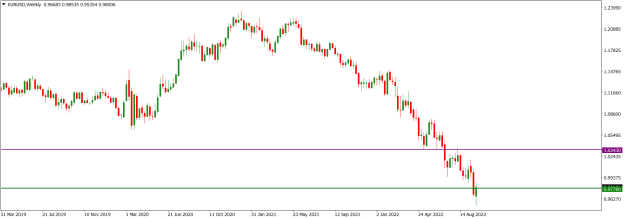
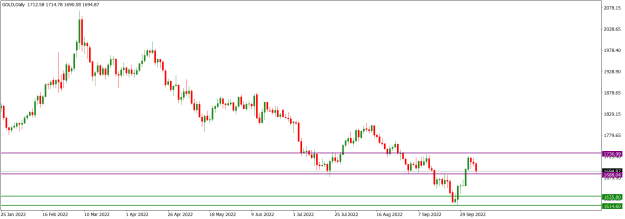
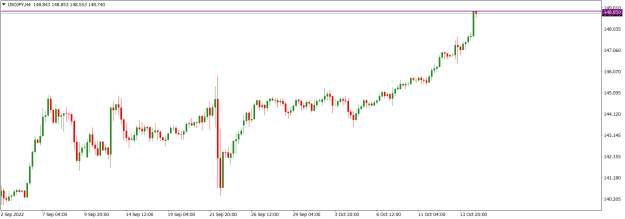
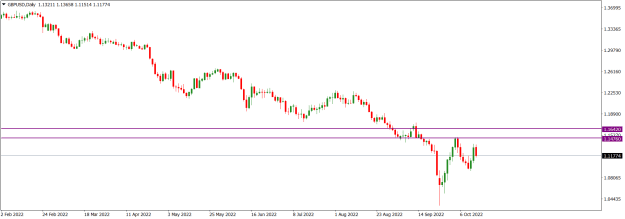
The 1.03260/0.98635 bearish swing on the EURSD daily time frame saw 61.8/78.6 Fib zonal retracement last week Monday and headed southwards on Tuesday. There was insignificant bullish price action throughout the week, and we may not see much northward directional momentum before further southward drive. However, we should be mindful of the fact that price action is within the 1.00810/0.99070 multi-year horizontal support zone (green) seen on the weekly time frame.

Attached Image (click to enlarge)
Click to Enlarge

Name: EURUSDDaily_September 18, 2022.png
Size: 14 KB


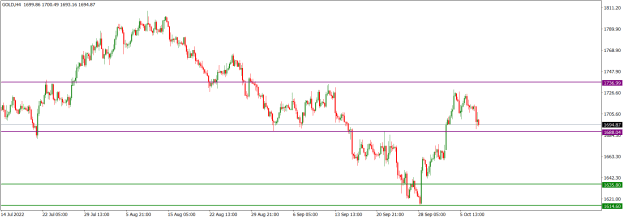
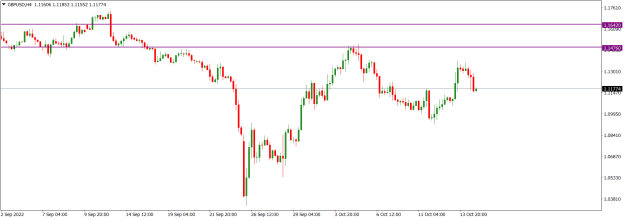
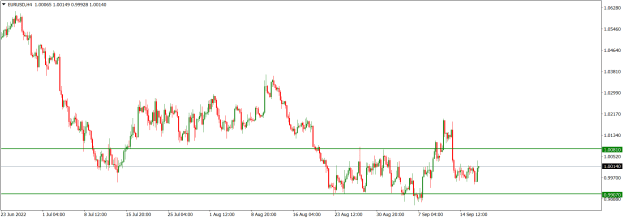
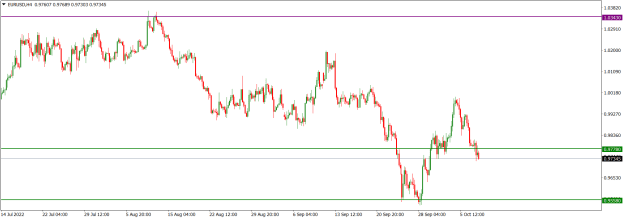
EURUSD price action on the H4 time frame is in a consolidation phase as it tackles the 1.00810/0.99070 multi-year horizontal support zone (green) seen on the weekly time frame. Although recent technical patterns favour bears, we may still have some northward move before any further southward drive.

Attached Image (click to enlarge)
Click to Enlarge

Name: EURUSDH4_September 18, 2022.png
Size: 15 KB


I may be wrong. Trade safe and prosper.

KP
Do your homework, follow the footprints of smart money
 
 
  • Post #1,562
  • Quote
  • Sep 25, 2022 3:43pm Sep 25, 2022 3:43pm
  •  KeenPips
  • Joined Dec 2015 | Status: Member | 7,405 Posts
XAUUSD Weekly Technical Outlook

XAUUSD market operation on the weekly time frame is bearish. It has broken down the 1683.15/1652.14 major horizontal support zone (green) which had been in place since April 2020. It is presently approaching the next significant horizontal support at the 1634.20/1614.60 zone (blue).

Attached Image (click to enlarge)
Click to Enlarge

Name: GOLDWeekly_September 25, 2022.png
Size: 13 KB


XAUUSD price action on the daily time frame is bearish. On Friday, it broke below the 1683.15/1652.14 major horizontal support zone (green) which had been in place since April 2020. However, it is about 110 pips to the next significant horizontal support at the 1634.20/1614.60 zone (blue). This may mean either a brief bearish surge towards the zone before a pullback or a bullish retest of the 1683.15/1652.14 previous horizontal support zone (green), which may flip it as resistance followed by a southward rotation. At any rate, what price action does by Monday close would interest me as the XAUUSD is the pair I trade mainly on an intra-day basis, but I don’t trade on Monday as a matter of principle.

Attached Image (click to enlarge)
Click to Enlarge

Name: GOLDDaily_September 25, 2022.png
Size: 13 KB


XAUUSD price action on the H4 time frame is bearish, but the bearish momentum is declining. Although we me see a bullish pullback, technicals still favour bears more than bulls.

Attached Image (click to enlarge)
Click to Enlarge

Name: GOLDH4_September 25, 2022.png
Size: 12 KB


I may be wrong. Trade safe and prosper.

KP
Do your homework, follow the footprints of smart money
 
 
  • Post #1,563
  • Quote
  • Sep 25, 2022 3:58pm Sep 25, 2022 3:58pm
  •  KeenPips
  • Joined Dec 2015 | Status: Member | 7,405 Posts
USDJPY Weekly Technical Outlook

The relatively long doji-like candlestick printed by USDJPY market operation on the weekly time frame last week indicates a decline of bullish directional momentum and an increase in bearish pressure. However, the candlestick printed last week issued another multi-year high before a bearish pushback.

Attached Image (click to enlarge)
Click to Enlarge

Name: USDJPYWeekly_September 25, 2022.png
Size: 12 KB


Although USDJPY price action on the daily time frame is in a bullish technical structure, presently it is sideways after a bearish pullback from the multi-year high it printed at the 145.900 area on Thursday. Technicals still favour bulls than bears, but we may have a bearish dip before further bullish drive.

Attached Image (click to enlarge)
Click to Enlarge

Name: USDJPYDaily_September 25, 2022.png
Size: 11 KB


USDJPY price action on the H4 time frame is in a bullish technical environment. Presently, it is tackling a minor horizontal resistance after an intra-day bearish dive, and we may still see further bearish move before further northward directional momentum.

Attached Image (click to enlarge)
Click to Enlarge

Name: USDJPYH4_September 25, 2022.png
Size: 12 KB


I may be wrong. Trade safe and prosper.

KP
Do your homework, follow the footprints of smart money
 
 
  • Post #1,564
  • Quote
  • Sep 25, 2022 4:28pm Sep 25, 2022 4:28pm
  •  KeenPips
  • Joined Dec 2015 | Status: Member | 7,405 Posts
EURUSD Weekly Technical Outlook

EURUSD market operation on the weekly time frame has broken down the 1.00810/0.99070 multi-year horizontal support zone (purple) flipping it to resistance. Last week’s bearish continuation candlestick printed in the zone surged towards the next major horizontal support around the 0.96200 area (green), which may lead to some bullish corrective move or a sideway of market operation before any further southward drive.

Attached Image (click to enlarge)
Click to Enlarge

Name: EURUSDWeekly_September 25, 2022.png
Size: 13 KB


EURUSD price action on the daily time frame remains in a bearish technical structure and in a falling channel (red). It broke down the 1.00810/0.99070 multi-year horizontal support zone (purple) seen on the weekly time frame and surged towards the next major horizontal support around the 0.96200 area (green). We may see a bullish market engineering before further bearish drive. I remain bearish EURUSD for a swing trading regime, which would await a bullish retracement to an area of value before looking for a feasible sell trading opportunity.

Attached Image (click to enlarge)
Click to Enlarge

Name: EURUSDDaily_September 5, 2022.png
Size: 16 KB


EURUSD price action on the H4 time frame is in a bearish technical structure. Meanwhile, there is decline in bearish momentum as price action approaches the major horizontal support around the 0.96200 area. Any bullish market engineering would be temporary in nature.

Attached Image (click to enlarge)
Click to Enlarge

Name: EURUSDH4_September 25, 2022.png
Size: 15 KB


I may be wrong. Trade safe and prosper.

KP
Do your homework, follow the footprints of smart money
 
 
  • Post #1,565
  • Quote
  • Sep 25, 2022 4:39pm Sep 25, 2022 4:39pm
  •  KeenPips
  • Joined Dec 2015 | Status: Member | 7,405 Posts
GBPUSD Weekly Technical Outlook

GBPUSD market operation continued its bearish mode as it created another multi-year low last week. The bearish candlestick printed last week broke below the previous 1.13410 low, printing another at the 1.08348 area (green), flipping the 1.1340 area (red) as resistance.

Attached Image (click to enlarge)
Click to Enlarge

Name: GBPUSDWeekly_September 25, 2022.png
Size: 14 KB


GBPUSD price action on the daily time frame restored its bearish mode after a relatively big bearish candlestick broke below a mini-consolidation area on Friday. This led to the creation of a multi-year low around the 1.08348 area (green). We may see a bullish correction before any further southward drive.

Attached Image (click to enlarge)
Click to Enlarge

Name: GBPUSDDaily_September 25, 2022.png
Size: 12 KB


GBPUSD price action on the H4 time frame is in a bearish technical structure but the bearish momentum is declining. This may give room for bulls to push for a northward corrective mode.

Attached Image (click to enlarge)
Click to Enlarge

Name: GBPUSDH4_September 25, 2022.png
Size: 11 KB


I may be wrong. Trade safe and prosper.

KP
Do your homework, follow the footprints of smart money
 
 
  • Post #1,566
  • Quote
  • Oct 2, 2022 3:35pm Oct 2, 2022 3:35pm
  •  KeenPips
  • Joined Dec 2015 | Status: Member | 7,405 Posts
XAUUSD Weekly Technical Outlook

XAUUSD market operation is technically bearish. On the monthly time frame, market operation in September surged below the 1683.15/1615.14 major horizontal support zone (green) and closed within it. Technically, there is still much room for further bearish drive. The next major horizontal support is at the 1593.75/1567.60 zone (blue).

Attached Image (click to enlarge)
Click to Enlarge

Name: GOLDMonthly_October 2, 2022.png
Size: 13 KB


Last week, XAUUSD market operation on the weekly time frame made a bullish retest of the broken down 1683.15/1615.14 major horizontal support zone (green). The bullish candlestick printed last week has shadows on both ends, indicating a struggle for market influence between bulls and bears. Technically, bears are more favoured than bulls and there is room for further bearish drive, a potential initial target being the 1635.80/1614.60 area (magenta).

Attached Image (click to enlarge)
Click to Enlarge

Name: GOLDWeekly_October 2, 2022.png
Size: 14 KB


XAUUSD price action on the daily time frame is experiencing a decline in bullish momentum as it makes a northward correction of the bearish breakdown of the 1683.15/1615.14 major horizontal support zone (green) seen on the monthly time frame. Any further bullish move would be temporary as technicals favour bears more than bulls and we would see a southward rotation, potentially targeting the 1635.80/1614.60 area (magenta).

Attached Image (click to enlarge)
Click to Enlarge

Name: GOLDDaily_October 2, 2022.png
Size: 13 KB


I may be wrong. Trade safe and prosper.

KP
Do your homework, follow the footprints of smart money
 
1
  • Post #1,567
  • Quote
  • Oct 2, 2022 3:52pm Oct 2, 2022 3:52pm
  •  KeenPips
  • Joined Dec 2015 | Status: Member | 7,405 Posts
USDJPY Weekly Technical Outlook

USDJPY market operation is in a bullish technical structure. On the monthly time frame, the bullish run in August established a major demand at the 132.250/135.350 zone (green) and broke above the previous multi-year horizontal resistance zone. The market operation in September surged into the 144.620/147.680 horizontal resistance zone (purple) that has been in place since August 1998, but there is increased bearish pressure in the area.

Attached Image (click to enlarge)
Click to Enlarge

Name: USDJPYMonthly_October 2, 2022.png
Size: 15 KB


USDJPY market operation on the weekly time frame is bullish. Two weeks ago, there was a bullish drive into the 144.620/147.680 horizontal resistance zone (purple) that has been in place since August 1998, but it was pushed back by bearish resistance and closed far below the zone. Although the bullish candlestick printed last week closed just at the lower boundary of the zone, it couldn’t penetrate the previous week’s high. Apparently, as market operation tackles the zone, there is increased bearish pressure.

Attached Image (click to enlarge)
Click to Enlarge

Name: USDJPYWeekly_October 2, 2022.png
Size: 12 KB


USDJPY price action on the daily time frame is consolidating as it tackles the 144.620/147.680 horizontal resistance zone (purple) that has been in place since August 1998. Based on the bullish activity last week Monday, before the sideways of the rest of the week, we may see further northward move, but this would likely be brief. We could see a southward market engineering to an area of value for liquidity grab before further bullish drive.

Attached Image (click to enlarge)
Click to Enlarge

Name: USDJPYDaily_October 2, 2022.png
Size: 14 KB


I may be wrong. Trade safe and prosper.

KP
Do your homework, follow the footprints of smart money
 
 
  • Post #1,568
  • Quote
  • Oct 2, 2022 4:17pm Oct 2, 2022 4:17pm
  •  KeenPips
  • Joined Dec 2015 | Status: Member | 7,405 Posts
GBPUSD Weekly Technical Outlook

The GBPUSD market is technically bearish. On the monthly time frame, the September market operation broke down the 1.13410 multi-year horizontal support (purple) and printed an all time low around the 1.03341 area before meeting bullish pressure.

Attached Image (click to enlarge)
Click to Enlarge

Name: GBPUSDMonthly_October 2, 2022.png
Size: 12 KB


GBPUSD market operation on the weekly time frame is in a bullish corrective mode after a bearish drive to the 1.03341 all time low. Last week’s market operation printed a relatively big bullish candlestick with long tail, which portends a relatively strong bullish momentum. Presently, market operation is about 150 pips below the broken down 1.13410 former multi-year horizontal support (purple) and we may see further northward market engineering before a southward rotation.

Attached Image (click to enlarge)
Click to Enlarge

Name: GBPUSDWeekly_October 2, 2022.png
Size: 13 KB


GBPUSD price action on the daily time frame is in a technically bearish structure but presently in a bullish corrective mode. There are some northward barriers to further bullish drive, which may incentivize a bearish turnaround.

Attached Image (click to enlarge)
Click to Enlarge

Name: GBPUSDDaily_October 2, 2022.png
Size: 11 KB


I may be wrong. Trade safe and prosper.

KP
Do your homework, follow the footprints of smart money
 
 
  • Post #1,569
  • Quote
  • Oct 2, 2022 4:41pm Oct 2, 2022 4:41pm
  •  KeenPips
  • Joined Dec 2015 | Status: Member | 7,405 Posts
EURUSD Weekly Technical Outlook

EURUSD market operation is bearish. On the monthly time frame, the July market operation made a bearish breakdown of the 1.03430 multi-year horizontal support (purple) flipping it as resistance. Presently, market operation is tackling the next horizontal support area around 0.97780 (green), which the September bearish candlestick broke through before snapping back.

Attached Image (click to enlarge)
Click to Enlarge

Name: EURUSDMonthly_October 2, 2022.png
Size: 15 KB


EURUSD market operation on the weekly time frame is in a technically bearish environment. However, last week, there was a bullish correction of the bearish breakdown of the long-term horizontal support around 0.97780 (green) seen on the monthly time frame. The bullish candlestick printed last week has a long tail and portends positive northward momentum. We may see further northward market engineering for liquidity grab before a southward turnaround.

Attached Image (click to enlarge)
Click to Enlarge

Name: EURUSDWeekly_October 2, 2022.png
Size: 13 KB


EURUSD price action on the daily time frame is making a bullish correction of a technically bearish structure after breaking down the long-term horizontal support around 0.97780 (green) seen on the monthly time frame. Presently, there is a decrease in bullish momentum as last Friday’s price action printed a doji-like candlestick. Apparently, there is imminent bearish turnaround of price action, perhaps after a northward retest of an area of value.

Attached Image (click to enlarge)
Click to Enlarge

Name: EURUSDDaily_October 2, 2022.png
Size: 12 KB


I may be wrong. Trade safe and prosper.

KP
Do your homework, follow the footprints of smart money
 
 
  • Post #1,570
  • Quote
  • Oct 9, 2022 4:16pm Oct 9, 2022 4:16pm
  •  KeenPips
  • Joined Dec 2015 | Status: Member | 7,405 Posts
XAUUSD Weekly Technical Update

XAUUSD market operation on the weekly time frame retested the 1736.99/1688.04 supply (purple) after surging to the 1635.80/1614.60 demand zone (green). The bullish candlestick printed last week to retest the supply zone (purple) has a long upper shadow, indicating a strong bearish pushback. A southward rotation may be imminent.

Attached Image (click to enlarge)
Click to Enlarge

Name: GOLDWeekly_October 9, 2022.png
Size: 14 KB


XAUUSD price action on the daily time frame is in a bearish trading range. After several days of bullish correction, a southward mode was restored on Wednesday. Technically, the market is poised for further southward move.

Attached Image (click to enlarge)
Click to Enlarge

Name: GOLDDaily_October 9, 2022.png
Size: 13 KB


XAUUSD price action on the H4 time frame is within a bearish trading range but recently made a bullish correction. Technical patterns (e.g., a retest of the midline of a minor ‘M’ pattern and intraday areas of market imbalance below the 1688.04 area) favour further southward price action.

Attached Image (click to enlarge)
Click to Enlarge

Name: GOLDH4_October 9, 2022.png
Size: 16 KB


I may be wrong. Trade safe and prosper.

KP
Do your homework, follow the footprints of smart money
 
1
  • Post #1,571
  • Quote
  • Oct 9, 2022 4:22pm Oct 9, 2022 4:22pm
  •  KeenPips
  • Joined Dec 2015 | Status: Member | 7,405 Posts
USDJPY Weekly Technical Outlook

USDJPY market is bullish. On the weekly time frame, USDJPY is tackling the 144.620/147.680 multi-year horizontal resistance zone (purple), which it surged into four weeks ago.

Attached Image (click to enlarge)
Click to Enlarge

Name: USDJPYWeekly_October 9, 2022.png
Size: 12 KB


Although USDJPY price action on the daily time frame is in a bullish technical structure, it is presently in a sideway mode as it tackles the lower part of the 144.620/147.680 multi-year horizontal resistance zone (purple) seen on the weekly time frame. Technicals still favour bulls more than bears.

Attached Image (click to enlarge)
Click to Enlarge

Name: USDJPYDaily_October 9, 2022.png
Size: 14 KB


USDJPY price action on the H4 time frame is in a consolidating mode within a bullish technical structure.

Attached Image (click to enlarge)
Click to Enlarge

Name: USDJPYH4_October 9, 2022.png
Size: 14 KB


I may be wrong. Trade safe and prosper.


KP
Do your homework, follow the footprints of smart money
 
 
  • Post #1,572
  • Quote
  • Oct 9, 2022 4:29pm Oct 9, 2022 4:29pm
  •  KeenPips
  • Joined Dec 2015 | Status: Member | 7,405 Posts
GBPUSD Weekly Technical Outlook


GBPUSD market operation on the weekly time frame made a bullish retest of the broken-down 1.13410 major horizontal support zone (purple) and issued a bearish rejection of the zone last week. The relatively big bearish pinbar printed around the zone last week portends the likelihood of further bearish market operation.

Attached Image (click to enlarge)
Click to Enlarge

Name: GBPUSDWeekly_October 9, 2022.png
Size: 13 KB


GBPUSD price action on the daily time frame is in a bearish structure. It made a bullish retest of the former 1.13410 major horizontal support zone (purple) and has flipped it as resistance. Presently, it is a minor horizontal support around 1.10850 but, technically, we would see further bearish move, perhaps, towards the 1.08500 value area (blue).

Attached Image (click to enlarge)
Click to Enlarge

Name: GBPUSDDaily_October 9, 2022.png
Size: 12 KB


GBPUSD price action on the H4 time frame made approximately 78.6 Fib retracement of the 1.17380/0.3340 bearish swing on October 4 before heading southwards. We may see further southward move in the early part of this week.

Attached Image (click to enlarge)
Click to Enlarge

Name: GBPUSDH4_Octberf 9, 2022.png
Size: 14 KB


I may be wrong. Trade safe and prosper.

KP
Do your homework, follow the footprints of smart money
 
 
  • Post #1,573
  • Quote
  • Oct 9, 2022 4:38pm Oct 9, 2022 4:38pm
  •  KeenPips
  • Joined Dec 2015 | Status: Member | 7,405 Posts
EURUSD Weekly Technical Outlook

EURUSD market operation is at the 0.97780/0.95580 multi-year horizontal support zone (green). On the weekly time frame, the technical structure is bearish with the breakdown, in the first week in July, of the previous multi-year horizontal support around the 1.03430 area (purple), flipping it as resistance. Last week saw the printing of a bearish pinbar after a bullish reaction of two weeks ago as market operation tackles the 0.97780/0.95580 multi-year horizontal support zone (green). This portends the likelihood of further bearish operation in the zone.

Attached Image (click to enlarge)
Click to Enlarge

Name: EURUSDWeekly_October 9, 2022.png
Size: 13 KB


EURUSD price action on the daily time frame is in a bearish structure. There was a bullish correction of the bearish drive to the 0.97780/0.95580 multi-year horizontal support zone (green) but the last three days saw price action restoring the bearish mode. We may see further bearish price action as the market tackles the 0.97780/0.95580 horizontal support zone (green).

Attached Image (click to enlarge)
Click to Enlarge

Name: EURUSDDaily_Octiber 9, 2022.png
Size: 12 KB


EURUSD price action has made a bullish correction of the 1.01870/0.95320 bearish range and presently the bearish mode is at play. We may see further bearish price action as the market tackles the 0.97780/0.95580 multi-year horizontal support zone (green) seen on the weekly time frame.

Attached Image (click to enlarge)
Click to Enlarge

Name: EURUSDH4_October 9, 2022.png
Size: 15 KB


I may be wrong. Trade safe and prosper.


KP
Do your homework, follow the footprints of smart money
 
1
  • Post #1,574
  • Quote
  • Oct 9, 2022 5:28pm Oct 9, 2022 5:28pm
  •  tenkanzen
  • | Membership Revoked | Joined May 2020 | 403 Posts
Nice thread. Would be great if you could include GBPJPY in your reports. Cheers.
 
1
  • Post #1,575
  • Quote
  • Oct 10, 2022 8:50am Oct 10, 2022 8:50am
  •  KeenPips
  • Joined Dec 2015 | Status: Member | 7,405 Posts
Thanks. I will consider doing so, perhaps once in a while, but I present analysis on the main pairs I follow/trade.

Trade safe and prosper.

KP

Quoting tenkanzen
Disliked
Nice thread. Would be great if you could include GBPJPY in your reports. Cheers.
Ignored
Do your homework, follow the footprints of smart money
 
1
  • Post #1,576
  • Quote
  • Oct 10, 2022 9:14am Oct 10, 2022 9:14am
  •  tenkanzen
  • | Membership Revoked | Joined May 2020 | 403 Posts
Quoting KeenPips
Disliked
Thanks. I will consider doing so, perhaps once in a while, but I present analysis on the main pairs I follow/trade. Trade safe and prosper. KP {quote}
Ignored
GBPJPY is a volatile pair that offers many opportunities throughout the day/different sessions...if you were to write about it, I will definitely be keen to read; I also believe there are many who trades this pair (although for some reason, the Dragon riders thread seems to be dead).

Cheers and thanks!
 
 
  • Post #1,577
  • Quote
  • Oct 16, 2022 3:29pm Oct 16, 2022 3:29pm
  •  KeenPips
  • Joined Dec 2015 | Status: Member | 7,405 Posts
XAUUSD Weekly Technical Outlook

XAUUSD market operation is bearish. On the weekly time frame, market operation flipped the former long-term horizontal support at the 1735.360/1688.040 zone (purple) as resistance after printing a top-tailed bullish candlestick two weeks ago. Last week’s bearish continuation candlestick edged towards the immediate horizontal support in the 1635.800/1614.600 zone (green).

Attached Image (click to enlarge)
Click to Enlarge

Name: GOLDWeekly_Oct 16, 2022.png
Size: 13 KB


XAUUSD price action on the daily time frame is operating in the 1802.250/1614.600 bearish trading range. It made about 61.8 Fib retracement of the swing on October 4 and it is presently disposed southwards. Technicals support further southward operation, and any bullish move would be corrective in nature.

Attached Image (click to enlarge)
Click to Enlarge

Name: GOLDDaily_Oct 16, 2022.png
Size: 15 KB


XAUUSD price action on the H4 time frame is in a bearish mode within a bearish trading range seen on the daily time frame. We can expect further southward move as price action retests the 1635.800/1614.600 horizontal support zone (green). Technically, any bullish move would be corrective.

Attached Image (click to enlarge)
Click to Enlarge

Name: GOLDH4_Oct 16, 2022.png
Size: 17 KB


I may be wrong. Trade safe and prosper.

KP
Do your homework, follow the footprints of smart money
 
 
  • Post #1,578
  • Quote
  • Oct 16, 2022 3:42pm Oct 16, 2022 3:42pm
  •  KeenPips
  • Joined Dec 2015 | Status: Member | 7,405 Posts
USDJPY Weekly Technical Outlook

USDJPY market operation has made a multi-year high around the 148.850 area (purple). On the weekly time frame, last week’s market operation broke above the previous multi-year horizontal resistance to create the multi-year high around 148.850. Technically, the fact that market operation struggled to produce significant bullish candlesticks for four weeks before last week indicate that it may be difficult to sustain further bullish drive. We may soon see a bearish correction.

Attached Image (click to enlarge)
Click to Enlarge

Name: USDJPYWeekly_Oct 16, 2022.png
Size: 12 KB


USDJPY price action on the daily time frame is bullish but it has recently struggled to break out of a multi-year horizontal resistance area to produce a multi-year high at the 148.850 area (purple). Much likely, we will see a bearish correction before further bullish drive.

Attached Image (click to enlarge)
Click to Enlarge

Name: USDJPYDaily_Oct 16, 2022.png
Size: 12 KB


USDJPY price action on the H4 time frame is bullish. However, after price action produced a multi-year high around the 148.850 area (purple), we can expect a bearish correction.

Attached Image (click to enlarge)
Click to Enlarge

Name: USDJPYH4_Oct 16, 2022.png
Size: 12 KB


I may be wrong. Trade safe and prosper.

KP
Do your homework, follow the footprints of smart money
 
 
  • Post #1,579
  • Quote
  • Oct 16, 2022 4:03pm Oct 16, 2022 4:03pm
  •  KeenPips
  • Joined Dec 2015 | Status: Member | 7,405 Posts
GBPJPY Weekly Technical Outlook

Note: I am posting this analysis on request as I rarely trade GBPJPY. I prefer trading the GBPUSD, which to me as a medium-term swing trader, is more predictable than GBPJPY.

GBPJPY market is in a bullish mode. On the weekly time frame, market operation is tackling the 167.790/ 170.420 major horizontal resistance zone (purple) but has so far failed to close within it. Last week’s market operation printed a relatively big bullish candlestick that closed above the candlesticks printed in the past several weeks but still fell shy of breaching the lower boundary of the zone. We may see further northward move as bulls make further attempt tackling the zone.

Attached Image (click to enlarge)
Click to Enlarge

Name: GBPJPYWeekly_Oct 16, 2022.png
Size: 14 KB


GBPJPY price action on the daily time frame is experiencing increased bearish pressure as it tackles the 167.790 horizontal resistance area (purple). Although we may still see further northward move, bears would be incentivized by weakness in bullish momentum; technically, this may open the way for a bearish correction.

Attached Image (click to enlarge)
Click to Enlarge

Name: GBPJPYDaily_Oct 16, 2022.png
Size: 15 KB


GBPJPY price action on the H4 time frame is in a consolidating mode as it attempts a retest of the 167.790 horizontal resistance area (purple) seen on the daily time frame. Although we may see further bullish move, bears are increasing pressure to hinder bulls. Apparently, a bearish correction is imminent.

Attached Image (click to enlarge)
Click to Enlarge

Name: GBPJPYH4_Oct 16, 2022.png
Size: 12 KB


I may be wrong. Trade safe and prosper.

KP
Do your homework, follow the footprints of smart money
 
 
  • Post #1,580
  • Quote
  • Oct 16, 2022 4:28pm Oct 16, 2022 4:28pm
  •  KeenPips
  • Joined Dec 2015 | Status: Member | 7,405 Posts
GBPUSD Weekly Technical Outlook

GBPUSD market operation on the weekly time frame is presently sideways in a technically bearish structure. The 1.16420/1.14760 supply zone (purple) was retested two weeks ago but market operation yielded a relatively big bearish pinbar. Last week, market operation made a bullish drive towards the zone, but the northward drive faltered, leaving shadows at both ends of the bullish candlestick printed.

Attached Image (click to enlarge)
Click to Enlarge

Name: GBPUSDWeekly_Oct 16, 2022.png
Size: 14 KB


GBPUSD price action on the daily time frame is in a technically bearish structure. However, presently, it is in a bullish corrective mode. Any further northward move would likely give way to a bearish turnaround. The 1.16420/1.14760 area (purple) is the prevailing horizontal resistance.

Attached Image (click to enlarge)
Click to Enlarge

Name: GBPUSDDaily_Oct 16, 2022.png
Size: 12 KB


GBPUSD price action on the H4 time frame is in a bullish corrective mode in the context of a bearish trading range. We may see further northward move for liquidity grab before a southward continuation.

Attached Image (click to enlarge)
Click to Enlarge

Name: GBPUSDH4_Oct 16, 2022.png
Size: 12 KB


I may be wrong. Trade safe and prosper.

KP
Do your homework, follow the footprints of smart money
 
1
  • Interactive Trading
  • /
  • Weekly Top-Down Technical Analyses
  • Reply to Thread
    • 1 7778Page 798081 84
    • 1 78Page 7980 84
0 traders viewing now
  • More
Top of Page
  • Facebook
  • Twitter
About FF
  • Mission
  • Products
  • User Guide
  • Media Kit
  • Blog
  • Contact
FF Products
  • Forums
  • Trades
  • Calendar
  • News
  • Market
  • Brokers
  • Trade Explorer
FF Website
  • Homepage
  • Search
  • Members
  • Report a Bug
Follow FF
  • Facebook
  • Twitter

FF Sister Sites:

  • Metals Mine
  • Energy EXCH
  • Crypto Craft

Forex Factory® is a brand of Fair Economy, Inc.

Terms of Service / ©2023