• Home
  • Forums
  • Trades
  • News
  • Calendar
  • Market
  • Brokers
  • Login
  • Join
  • User/Email: Password:
  • 10:12pm
Menu
  • Forums
  • Trades
  • News
  • Calendar
  • Market
  • Brokers
  • Login
  • Join
  • 10:12pm
Sister Sites
  • Metals Mine
  • Energy EXCH
  • Crypto Craft

Options

Bookmark Thread

First Page First Unread Last Page Last Post

Print Thread

Similar Threads

Major Pairs/Crosses - Trading Scenarios, Analyses & Forecasts 15 replies

Weekly/Monthly TOP Gainers Forexfactory Traders 4 replies

Long Term Analyses - EURUSD, GOLD, and S&P 76 replies

USD/CAD - Loonie Toons, & mostly pointless analyses 2 replies

Lazy analyses thread 56 replies

  • Interactive Trading
  • /
  • Reply to Thread
  • Subscribe
  • 3,656
Attachments: Weekly Top-Down Technical Analyses
Exit Attachments
Tags: Weekly Top-Down Technical Analyses
Cancel

Weekly Top-Down Technical Analyses

  • Last Post
  •  
  • 1 7677Page 787980 84
  • 1 77Page 7879 84
  •  
  • Post #1,541
  • Quote
  • Aug 21, 2022 4:01pm Aug 21, 2022 4:01pm
  •  KeenPips
  • Joined Dec 2015 | Status: Member | 7,405 Posts
XAUUSD Weekly Technical Outlook

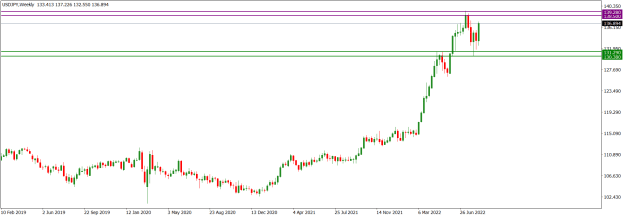
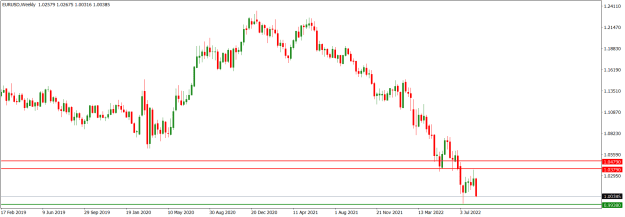
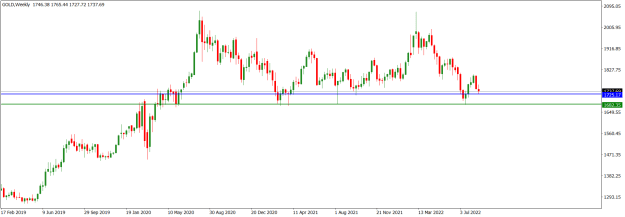
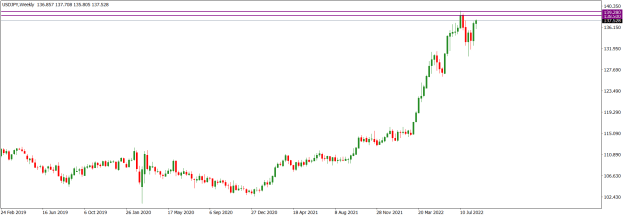
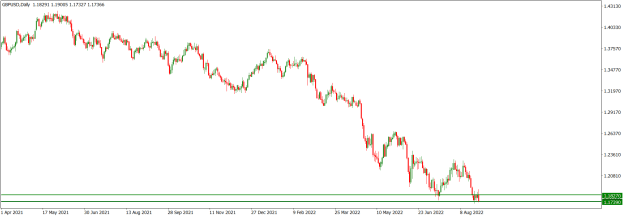
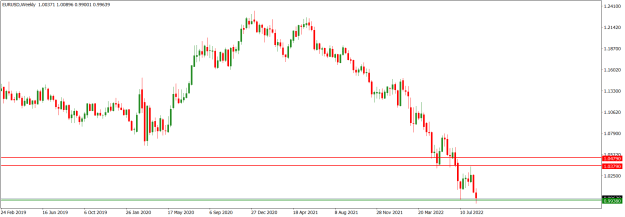
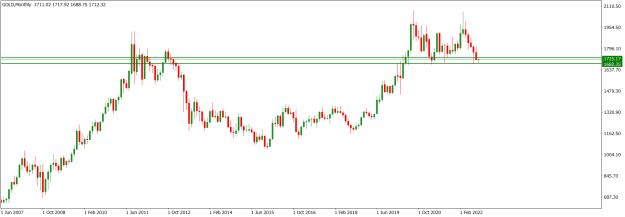
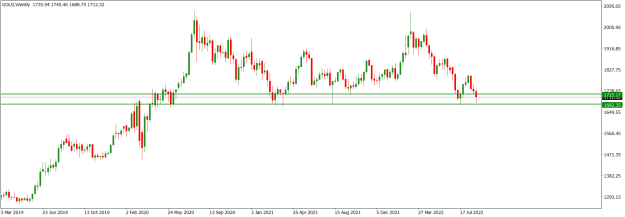
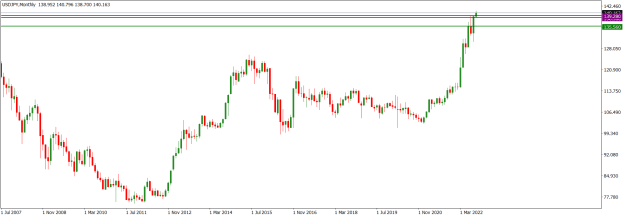
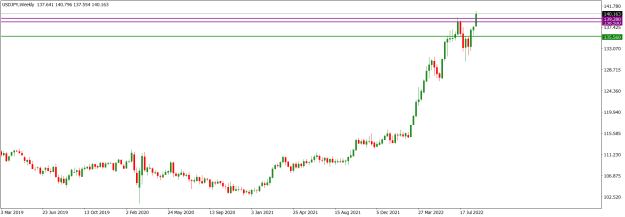
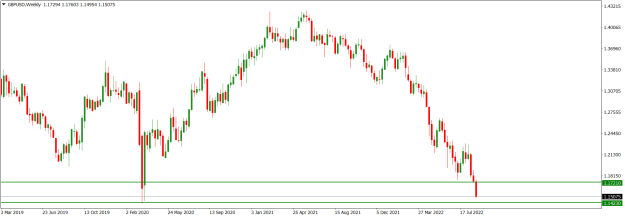
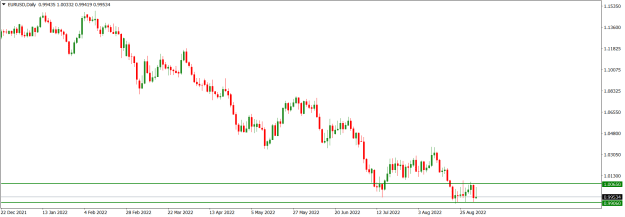
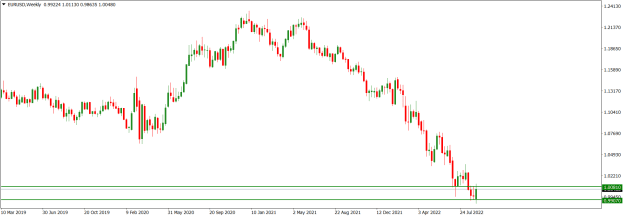
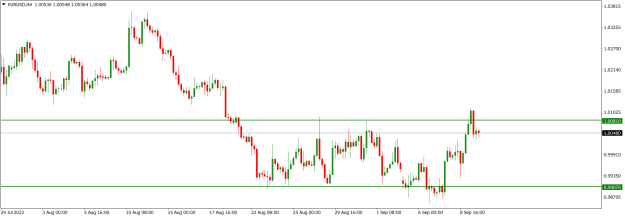
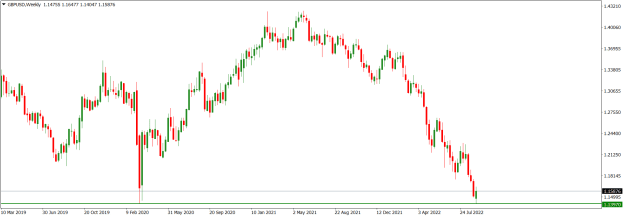
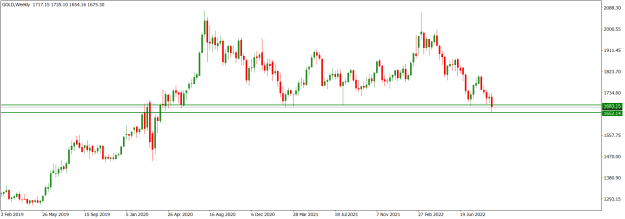
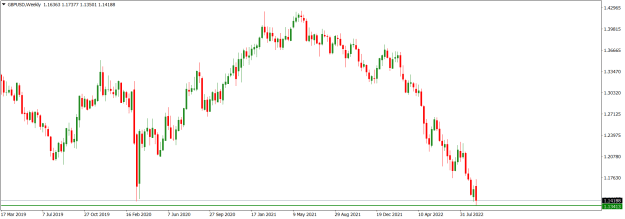
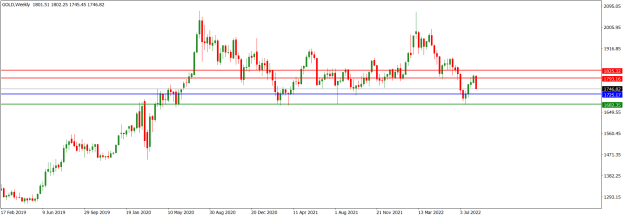
XAUUSD market operation on the weekly time frame has turned bearish after a bullish correction to retest the broken down 1825.32/1793.16 former horizontal support (red) flipping it as resistance. Further southward move may see a retest the 1725.17 near-term horizontal support (blue), which may later expose the 1682.35 long-term horizontal support (green).

Attached Image (click to enlarge)
Click to Enlarge

Name: GOLDWeekly_August 21, 2022.png
Size: 14 KB


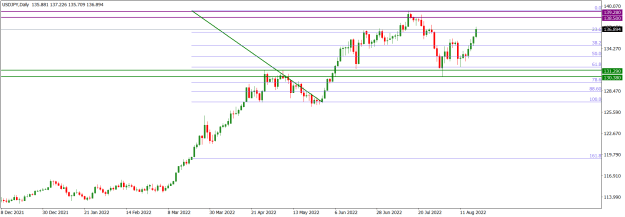
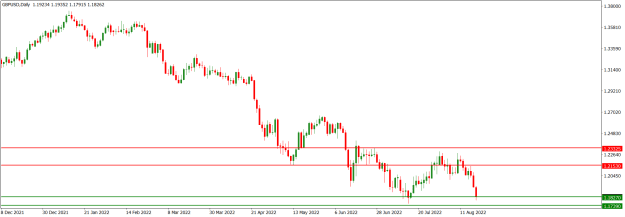
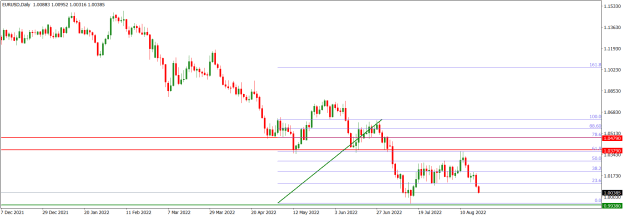
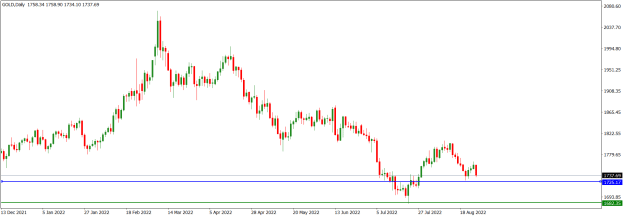
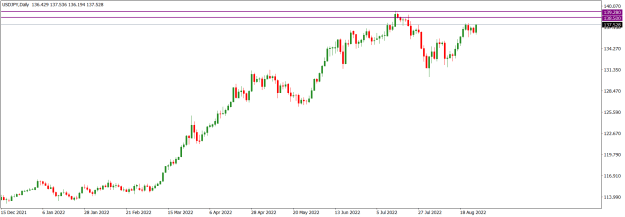
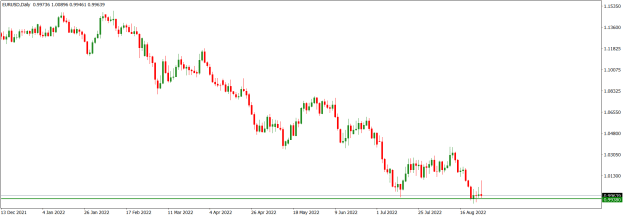
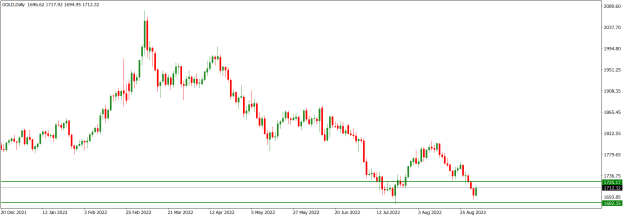
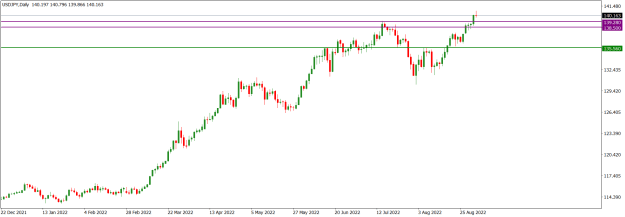
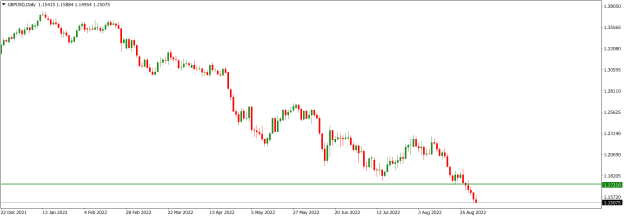
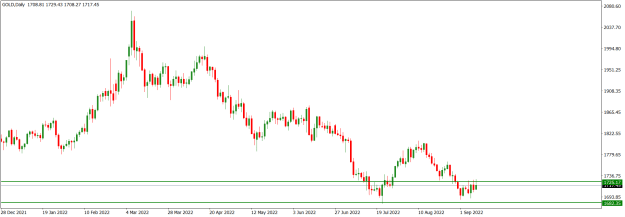
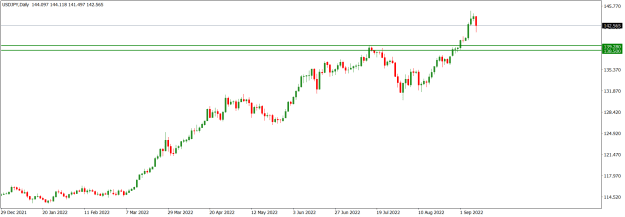
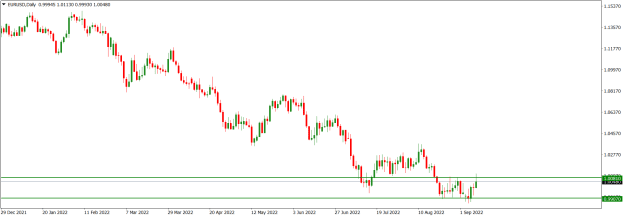
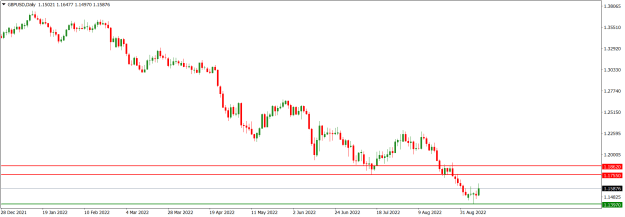
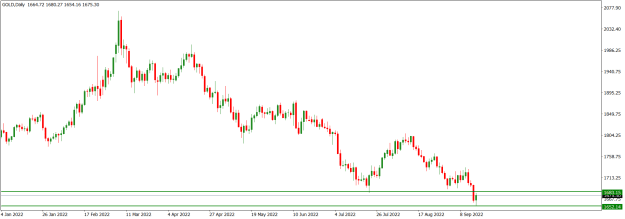
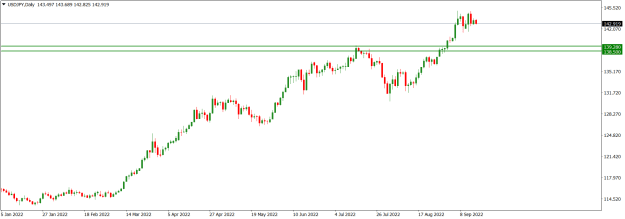
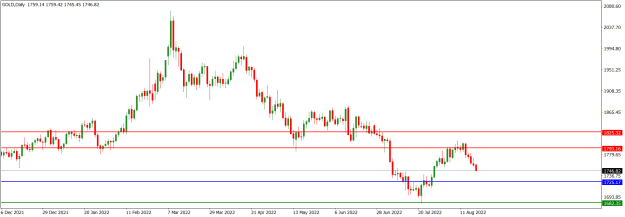
XAUUSD price action on the daily time frame is in a bearish mode within a bearish technical structure. Any bullish move would be corrective in nature, which may be a good opportunity for a bearish fading trade.

Attached Image (click to enlarge)
Click to Enlarge

Name: GOLDDaily_August 21, 2022.png
Size: 13 KB


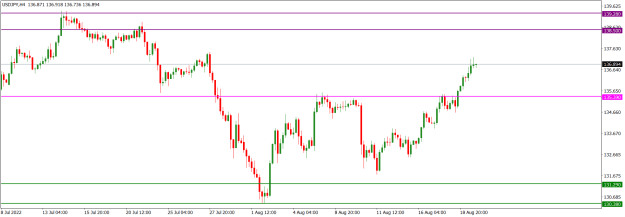
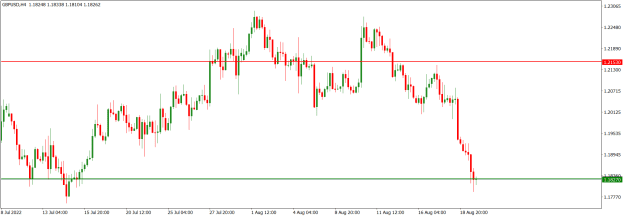
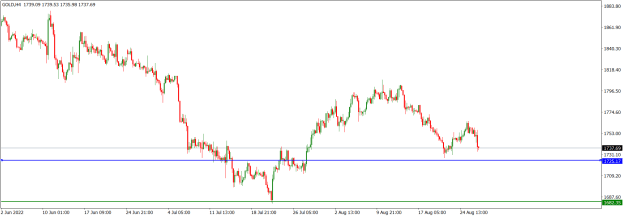
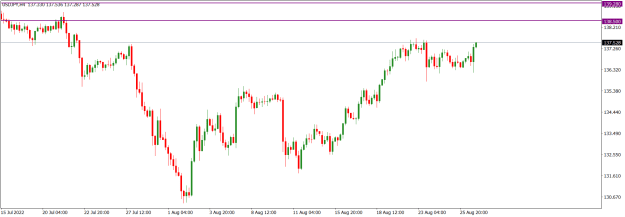
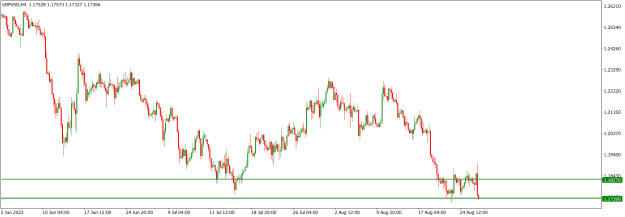
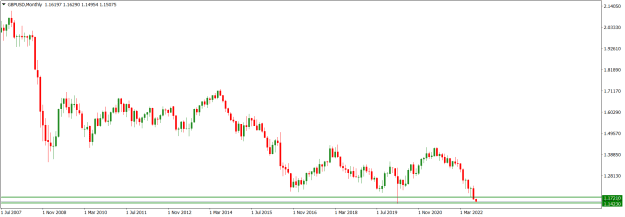
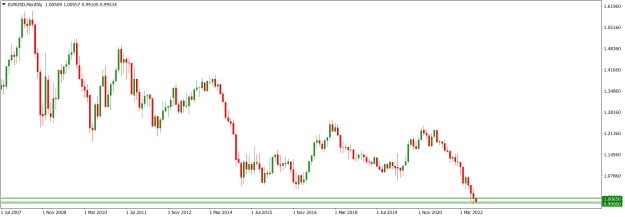
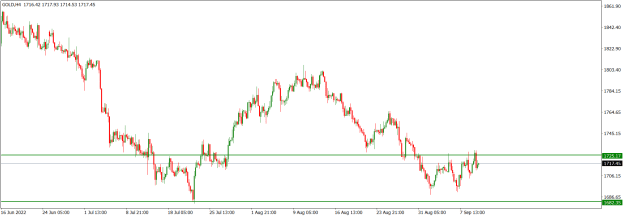
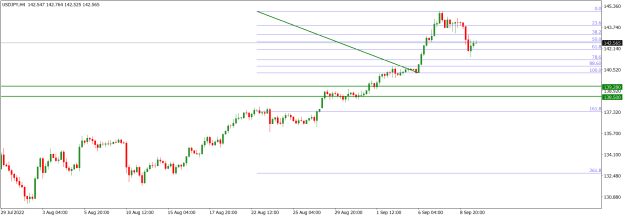
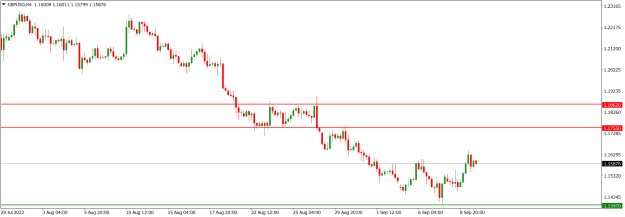
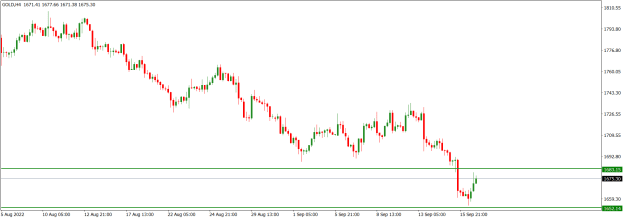
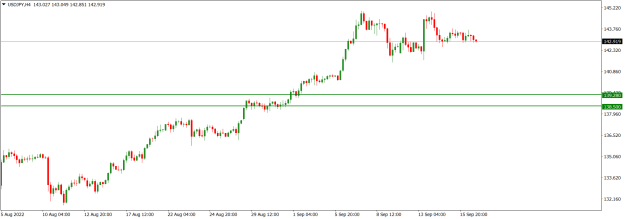
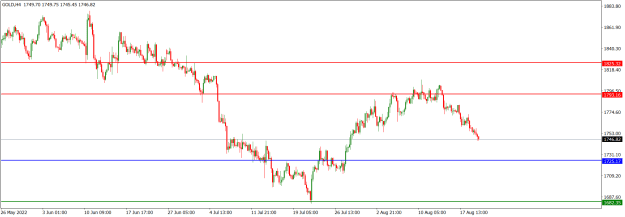
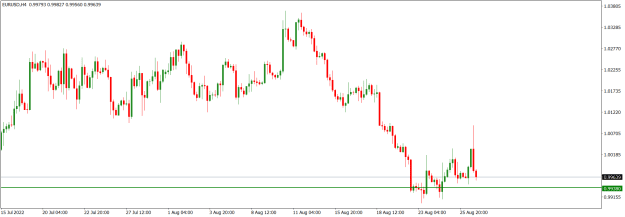
XAUUSD price action on the H4 time frame is in a bearish mode. Although we may see some bullish corrective move, the dominant technical structure is bearish.

Attached Image (click to enlarge)
Click to Enlarge

Name: GOLDH4_August 21, 2022.png
Size: 15 KB


I may be wrong. Trade safe and prosper.

KP
Do your homework, follow the footprints of smart money
 
 
  • Post #1,542
  • Quote
  • Aug 21, 2022 4:11pm Aug 21, 2022 4:11pm
  •  KeenPips
  • Joined Dec 2015 | Status: Member | 7,405 Posts
USDJPY Weekly Technical Outlook

USDJPY market operation is bullish. On the weekly time frame, there was a bullish rejection of the 131.290/130.380 horizontal support (green) two weeks ago. Last week, a relatively big bullish continuation candlestick was printed, and we may see bulls further their ambition further by threatening the long-term 138.500/139.280 horizontal resistance zone (purple).

Attached Image (click to enlarge)
Click to Enlarge

Name: USDJPYWeekly_August 21, 2022.png
Size: 13 KB


USDJPY price action on the daily time is operating in a bullish structure. There was a 78.6 Fib retracement of the 126.680/139.280 bullish swing on August 2. Presently, price action is navigating the 136.890 minor horizontal resistance, but we would soon see further bullish directional move.

Attached Image (click to enlarge)
Click to Enlarge

Name: USDJPYDaily_August 21, 2022.png
Size: 14 KB


USDJPY technical pattern on the H4 time frame has maneuvered above the recent bearish pressure and it is on a bullish mode. The dominant technical structure is bullish.

Attached Image (click to enlarge)
Click to Enlarge

Name: USDJPYH4_August 21, 2021.png
Size: 14 KB


I may be wrong. Trade safe and prosper.

KP
Do your homework, follow the footprints of smart money
 
 
  • Post #1,543
  • Quote
  • Aug 21, 2022 4:27pm Aug 21, 2022 4:27pm
  •  KeenPips
  • Joined Dec 2015 | Status: Member | 7,405 Posts
GBPUSD Weekly Technical Outlook

GBPUSD market operation on the weekly time frame turned bearish after retesting the 1.23325/1.21530 horizontal resistance (red). Last week’s bearish candlestick dropped from the area and surged to the 1.18270/1.17390 horizontal support (green) before meeting a bullish pushback. We can expect further southward move in the area. However, a bullish correction followed by a southward rotation would see a bearish drive, which, perhaps, in the nearest future may threaten the 1.14250 handle.

Attached Image (click to enlarge)
Click to Enlarge

Name: GBPUSDWeekly_August 21, 2022.png
Size: 14 KB


GBPUSD price action on the daily time frame is bearish. Although technicals and the order flow favour further southward move we may still witness a bullish correction, as price action tackles the 1.18270/1.17390 horizontal support zone (green), before further southward drive.

Attached Image (click to enlarge)
Click to Enlarge

Name: GBPUSDDaily_August 21, 2022.png
Size: 12 KB


GBPUD price action on the H4 time frame is bearish. As recent bearish candlestick prints had left areas of price imbalance northward, we may see bullish market engineering for liquidity grab before further southward drive.

Attached Image (click to enlarge)
Click to Enlarge

Name: GBPUSDH4_August 21, 2022.png
Size: 13 KB


I may be wrong. Trade safe and prosper.

KP
Do your homework, follow the footprints of smart money
 
 
  • Post #1,544
  • Quote
  • Aug 21, 2022 4:42pm Aug 21, 2022 4:42pm
  •  KeenPips
  • Joined Dec 2015 | Status: Member | 7,405 Posts
EURUSD Weekly Technical Outlook

Two weeks ago, EURUSD market operation on the weekly time frame made a bullish attempt to retest the broken down 1.03790/1.04790 former horizontal support zone (red) but failed, printing a relatively long upper shadow a few pips below the zone. A bearish rotation occurred last week with the printing of a relatively big bearish candlestick which broke below a horizontal support area that was formed six weeks ago. Any further southward move may threaten the 0.99380 multi-year horizontal support (green).

Attached Image (click to enlarge)
Click to Enlarge

Name: EURUSDWeekly_August 21, 2022.png
Size: 13 KB


EURUSD price action on the daily time frame turned bearish after making a 61.8 Fib retracement of the 1.06360/0.99380 bearish swing several days ago. We can expect further bearish move, perhaps to retest the 0.99380 multi-year horizontal support (green).

Attached Image (click to enlarge)
Click to Enlarge

Name: EURUSDDaily_August 21, 2022.png
Size: 14 KB


EURUSD technical structure and order flow context on the H4 time frame support a bearish continuation. Although we may soon see a retest of the 0.99380 multi-year horizontal support (green) seen on the weekly time frame, we cannot rule out a brief northward pullback to an area of value before a southward continuation.

Attached Image (click to enlarge)
Click to Enlarge

Name: EURUSDH4_August 21, 2022.png
Size: 15 KB


I may be wrong. Trade safe and prosper.

KP
Do your homework, follow the footprints of smart money
 
 
  • Post #1,545
  • Quote
  • Aug 28, 2022 3:46pm Aug 28, 2022 3:46pm
  •  KeenPips
  • Joined Dec 2015 | Status: Member | 7,405 Posts
XAUUSD Weekly Technical Outlook

XAUUSD market operation on the weekly time frame is retesting a recent horizontal support around the 1725.17 area (blue). Meanwhile, it is experiencing a weakness in bearish drive given the ambivalent nature of last week’s candlestick print. However, a significant bearish breakdown of the area may see a southward push towards the 1682.35 long-term horizontal support zone (green).

Attached Image (click to enlarge)
Click to Enlarge

Name: GOLDWeekly_August 28, 2022.png
Size: 13 KB


XAUUSD technical structure on the daily time frame is bearish but price action is in a corrective mode as it rechallenges a recent horizontal support around the 1725.17 area (blue). A bearish breakdown may initially target the 1705.00 area.

Attached Image (click to enlarge)
Click to Enlarge

Name: GOLDDaily_August 28, 2022.png
Size: 13 KB


XAUUSD technicals and order flow on the H4 time frame support further bearish move.

Attached Image (click to enlarge)
Click to Enlarge

Name: GOLDH4_August 28, 2022.png
Size: 15 KB


I may be wrong. Trade safe and prosper.

KP
Do your homework, follow the footprints of smart money
 
 
  • Post #1,546
  • Quote
  • Aug 28, 2022 4:26pm Aug 28, 2022 4:26pm
  •  KeenPips
  • Joined Dec 2015 | Status: Member | 7,405 Posts
USDJPY Weekly Technical Outlook

USDJPY market operation is bullish. On the weekly time frame, the technical structure is bullish, and the candlestick printed two weeks ago was a bullish continuation. Last week’s bullish pinbar supports further bullish intent but as market operation approaches the 138.300/139.280 multi-year horizontal resistance zone (purple) we would soon see a strong bearish challenge.

Attached Image (click to enlarge)
Click to Enlarge

Name: USDJPYWeekly_August 28, 2022.png
Size: 13 KB


USDJPY price action on the daily time frame is sideways as it approaches the 138.300/139.280 multi-year horizontal resistance zone (purple). However, technicals still favour bulls, and we may still see further northward move in the early part of this week.

Attached Image (click to enlarge)
Click to Enlarge

Name: USDJPYDaily_August 28, 2022.png
Size: 12 KB


USDJPY price action on the H4 time frame is bullish but experiencing a bearish challenge. It is about 100 pips below the 138.300/139.280 multi-year horizontal resistance zone (purple) seen on the weekly time frame. Technically, we would see further bearish challenge as price action gets nearer the zone.

Attached Image (click to enlarge)
Click to Enlarge

Name: USDJPYH4_August 28, 2022.png
Size: 13 KB


I may be wrong. Trade safe and prosper.

KP
Do your homework, follow the footprints of smart money
 
 
  • Post #1,547
  • Quote
  • Aug 28, 2022 4:29pm Aug 28, 2022 4:29pm
  •  KeenPips
  • Joined Dec 2015 | Status: Member | 7,405 Posts
GBPUSD Weekly Technical Outlook

GBPUSD market operation is bearish. On the weekly time frame, market operation is within the 1.18270/1.17390 horizontal support zone (green), but any further southward move will have to contend with the nearby 1.16270 value area.

Attached Image (click to enlarge)
Click to Enlarge

Name: GBPUSDWeekly_August 28, 2022.png
Size: 14 KB


GBPUSD price action on the daily time frame is in consolidation within the 1.18270/1.17390 horizontal support zone (green). The bearish candlestick printed on Friday broke down a minor area of consolidation created on Wednesday and Thursday but could not break below the open of the bullish candlestick printed on Tuesday. Should bears fail to maintain market influence, we may see a bullish pullback to an area of value before further southward drive.

Attached Image (click to enlarge)
Click to Enlarge

Name: GBPUSDDaily_August 28, 2022.png
Size: 14 KB


GBPUSD price action on the H4 time frame is consolidating in the 1.18270/1.17390 horizontal support zone (green) seen on the weekly time frame. Presently, price action is at the lower boundary and there was an insignificant bearish print in the last H4-session on Friday. Perhaps, we will see a bullish pushback in the early part of this week.

Attached Image (click to enlarge)
Click to Enlarge

Name: GBPUSDH4_August 28, 2022.png
Size: 15 KB


I may be wrong. Trade safe and prosper.

KP
Do your homework, follow the footprints of smart money
 
 
  • Post #1,548
  • Quote
  • Aug 28, 2022 4:43pm Aug 28, 2022 4:43pm
  •  KeenPips
  • Joined Dec 2015 | Status: Member | 7,405 Posts
EURUSD Weekly Technical Outlook

EURUD market operation is bearish. On the weekly time frame, last week market operation made a bearish follow-through to retest the 0.99380 multi-year horizontal support (green). As last week’s bearish print has shadows on both ends, we may not see much directional drive in the early part of this week.

Attached Image (click to enlarge)
Click to Enlarge

Name: EURUSDWeekly_August 28, 2022.png
Size: 13 KB


EURUSD price action on the daily time frame turned sideways after a brief bullish retracement from the 0.99380 multi-year horizontal support (green). As the last two days saw the printing of top-tailed doji-like candlesticks, in the context of a weak bullish pushback, we may see some southward move in the early part of this week.

Attached Image (click to enlarge)
Click to Enlarge

Name: EURUSDDaily_August 28, 2022.png
Size: 12 KB


EURUSD price action on the H4 time frame is in a corrective mode in a bearish environment. However, as price action is tackling the 0.99380 multi-year horizontal support (green) we may not see a sustained southward move in the early part of this week.

Attached Image (click to enlarge)
Click to Enlarge

Name: EURUSDH4_August 28, 2022.png
Size: 12 KB


I may be wrong. Trade safe and prosper.

KP
Do your homework, follow the footprints of smart money
 
 
  • Post #1,549
  • Quote
  • Sep 4, 2022 4:02pm Sep 4, 2022 4:02pm
  •  KeenPips
  • Joined Dec 2015 | Status: Member | 7,405 Posts
XAUUSD Weekly Technical Outlook

XAUUSD on the monthly time frame is within the 1725.17/1682.35 horizontal support zone (green). In July, a bearish candlestick printed a long bottom tail that spanned the, an indication of a bullish pushback from the zone. However, in August, a bearish continuation candlestick closed at the upper part of the zone, suggesting that bears are still influential in the market.

Attached Image (click to enlarge)
Click to Enlarge

Name: GOLDMonthly_September 4, 2022.png
Size: 12 KB


XAUUSD market operation on the weekly time frame is retesting the 1725.17/1682.35 horizontal support zone (green) seen on the monthly time frame. Last week, a bearish candlestick retested the zone, six weeks after a bullish breakout from the zone, but met a bullish pushback, resulting in the printing of a bottom tail in the zone. We may still see further attempt to break down the zone in the early part of this week.

Attached Image (click to enlarge)
Click to Enlarge

Name: GOLDWeekly_September 4, 2022.png
Size: 13 KB


XAUSD price action on the daily time frame has turned sideways as it revisits the 1725.17/1682.35 horizontal support zone (green) seen on the monthly time frame. Recent candlestick prints give an edge to bears and we may still see further southward move in the early part of this week.

Attached Image (click to enlarge)
Click to Enlarge

Name: GOLDDaily_September 4, 2022.png
Size: 13 KB


I may be wrong. Trade safe and prosper.

KP
Do your homework, follow the footprints of smart money
 
 
  • Post #1,550
  • Quote
  • Sep 4, 2022 4:08pm Sep 4, 2022 4:08pm
  •  KeenPips
  • Joined Dec 2015 | Status: Member | 7,405 Posts
USDJPY Weekly Technical Outlook

USDJPY market operation is bullish. On the monthly time frame, in August, market operation printed a bullish candlestick that broke above the 135.560 horizontal resistance (green), which would flip as support as market operation tackles the 138.500/139.280 multi-year horizontal resistance zone (purple).

Attached Image (click to enlarge)
Click to Enlarge

Name: USDJPYMonthly_September 4, 2022.png
Size: 13 KB


USDJPY market operation on the weekly time frame is bullish. Last week, market operation printed a bullish candlestick that broke above the 138.500/139.280 multi-year horizontal resistance zone (purple) seen on the monthly time frame. A bearish retracement followed by a bullish pushback may flip the zone as support.

Attached Image (click to enlarge)
Click to Enlarge

Name: USDJPYWeekly_September 4, 2022.png
Size: 13 KB


USDJPY price action on the daily time frame is bullish but presently experiencing a bearish pushback as it navigates above the 138.500/139.280 multi-year horizontal resistance zone (purple) seen on the monthly time frame. We may see a bearish corrective move in the early part of this week, but the technical structure is still bullish.

Attached Image (click to enlarge)
Click to Enlarge

Name: USDJPYDaily_September 4, 2022.png
Size: 12 KB


I may be wrong. Trade safe and prosper.

KP
Do your homework, follow the footprints of smart money
 
 
  • Post #1,551
  • Quote
  • Sep 4, 2022 4:21pm Sep 4, 2022 4:21pm
  •  KeenPips
  • Joined Dec 2015 | Status: Member | 7,405 Posts
GBPUSD Weekly Technical Outlook

GBPUSD market operation is bearish. On the monthly time frame, a bearish candlestick was printed in August and closed below the indecision candlestick printed in July. Technically, market operation is in a bearish structure, but it is tackling the 1.17210/1.14230 significant horizontal support zone (green).

Attached Image (click to enlarge)
Click to Enlarge

Name: GBPUSDMonthly_September 4, 2022.png
Size: 12 KB


GBPUSD market operation on the weekly time frame is bearish. A bearish continuation candlestick was printed last week, and it surged into the 1.17210/1.14230 significant horizontal support zone (green) seen on the monthly time frame. Although we may still see further bearish move in the early part of this week, a bullish correction is in the offing.

Attached Image (click to enlarge)
Click to Enlarge

Name: GBPUSDWeekly_September 4, 2022.png
Size: 14 KB


GBPUSD price action on the daily time frame is bearish. It broke below the 1.17210 horizontal support (green) a few days ago. But there is a decline in bearish drive, judging from the relatively small size of recent candlesticks printed. The 1.17210 area is the upper boundary of the 1.17210/1.14230 significant horizontal support zone seen on the monthly time frame, and we may still see further southward move before a bullish pullback.

Attached Image (click to enlarge)
Click to Enlarge

Name: GBPUSDDaily_September 4, 2022.png
Size: 12 KB


I may be wrong. Trade safe and prosper.

KP
Do your homework, follow the footprints of smart money
 
 
  • Post #1,552
  • Quote
  • Sep 4, 2022 4:37pm Sep 4, 2022 4:37pm
  •  KeenPips
  • Joined Dec 2015 | Status: Member | 7,405 Posts
EURUSD Weekly Technical Outlook

EURUSD market operation is bearish, but it is tackling a major horizontal support. On the monthly time frame, last month, market operation printed a bearish candlestick that surged to the 1.00650/0.99060 multi-year horizontal support zone (green) before meeting a bullish pushback, ending up with shadows at both ends. The bullish pushback indicates that we would see a decline in bearish drive as market operation tackles the zone.

Attached Image (click to enlarge)
Click to Enlarge

Name: EURUSDMonthly_September 4, 2022.png
Size: 13 KB


EURUSD market operation on the weekly time frame is bearish but there is a decline in bearish momentum as market operation tackles the 1.00650/0.99060 multi-year horizontal support zone (green). Last week, a long-tailed doji-like candlestick was printed in the zone.

Attached Image (click to enlarge)
Click to Enlarge

Name: EURUSDWeekly_September 4, 2022.png
Size: 13 KB


EURUSD price action on the daily time frame is sideways within a bearish technical structure as price action tackles the 1.00650/0.99060 multi-year horizontal support zone (green) seen on the monthly time frame. Until there is significant bearish breakdown of the zone on a daily closing basis, preferably followed by a bullish pullback and a bearish rejection to flip the zone as resistance, we may not see much directional momentum. Meanwhile, any northward move would be temporary, and, perhaps, for liquidity grab at an area of value.

Attached Image (click to enlarge)
Click to Enlarge

Name: EURUSDDaily_September 4, 2022.png
Size: 12 KB


I may be wrong. Trade safe and prosper.

KP
Do your homework, follow the footprints of smart money
 
 
  • Post #1,553
  • Quote
  • Sep 11, 2022 3:58pm Sep 11, 2022 3:58pm
  •  KeenPips
  • Joined Dec 2015 | Status: Member | 7,405 Posts
XAUUSD Weekly Technical Outlook

XAUUSD market operation on the weekly time frame has turned sideways as it tackles the 1725.17/1682.35 long-term horizontal support zone (green). Last week’s candlestick was doji-like, indicating a decline in directional momentum.


Attached Image (click to enlarge)
Click to Enlarge

Name: GOLDWeekly_September 11, 2022.png
Size: 13 KB

XAUSD price action on the daily time frame is sideways, indicating a decline in bearish drive after a bearish retest of the 1725.17/1682.35 long-term horizontal support zone (green) seen on the weekly time frame. Presently, only an intra-day trading set-up within the zone may be considered, perhaps in the context of an H4 technical structure. Personally, I don’t trade on Mondays, so I will re-assess the market after Monday close.

Attached Image (click to enlarge)
Click to Enlarge

Name: GOLDDaily_September 11, 2022.png
Size: 13 KB


XAUUSD technical structure on the H4 is bearish. Meanwhile, price action on the H4 time frame is in a corrective mode within the 1725.17/1682.35 long-term horizontal support zone (green) seen on the weekly time frame. A bullish move to an area of value, e.g., a northward retest of the upper part of the 1725.50 area, would offer a sell trading opportunity as it is aligned with the prevailing technical structure.

Attached Image (click to enlarge)
Click to Enlarge

Name: GOLDH4_September 11, 2022.png
Size: 15 KB


I may be wrong. Trade safe and prosper.

KP
Do your homework, follow the footprints of smart money
 
 
  • Post #1,554
  • Quote
  • Sep 11, 2022 4:15pm Sep 11, 2022 4:15pm
  •  KeenPips
  • Joined Dec 2015 | Status: Member | 7,405 Posts
USDJPY Weekly Technical Outlook

USDJPY market operation has maintained its bullish outlook. On the weekly time frame, market operation has broken above the 138.500/139.290 multi-year horizontal resistance zone (green), flipping it to support. However, last week’s bullish continuation candlestick has an upper shadow, indicating a bearish challenge to further northward drive.

Attached Image (click to enlarge)
Click to Enlarge

Name: USDJPYWeekly_September 11, 2022.png
Size: 12 KB


USDJPY price action on the daily time frame is experiencing some bearish challenge after it punched through the 138.500/139.290 multi-year horizontal resistance zone (green) seen on the weekly time frame. The price action is still operating in a bullish technical structure and any bearish move may not be sustained. I am bullish on this market but, as a swing trader, I will await a bearish decline at a value area before looking for a feasible buy trading set-up.

Attached Image (click to enlarge)
Click to Enlarge

Name: USDJPYDaily_September 11, 2022.png
Size: 12 KB


USDJPY price action on the H4 time frame has issued a 78.6 Fib retracement of the 140.298/144.945 intra-day bullish swing but we may still have a bearish engineering for liquidity grab before further northward drive. So, I will await further southward move before looking for a buy trading opportunity.

Attached Image (click to enlarge)
Click to Enlarge

Name: USDJPYH4_September 11, 2022.png
Size: 14 KB


I may be wrong. Trade safe and prosper.

KP
Do your homework, follow the footprints of smart money
 
 
  • Post #1,555
  • Quote
  • Sep 11, 2022 4:30pm Sep 11, 2022 4:30pm
  •  KeenPips
  • Joined Dec 2015 | Status: Member | 7,405 Posts
EURUSD Weekly Technical Outlook

EURUSD market operation is in a bullish correction of a bearish technical structure. On the weekly time frame, last week, market operation printed a bullish candlestick in reaction to the bearish drive that retested the 1.00810/0.99070 multi-year horizontal support zone (green). The shadows on both ends of last week’s bullish candlestick indicate that we can expect further struggle for market influence between bears and bulls, at least in the early part of this week.

Attached Image (click to enlarge)
Click to Enlarge

Name: EURUSDWeekly_September 11, 2022.png
Size: 13 KB


EURUSD price action on the daily time frame is operating in the 1.00810/0.99070 multi-year horizontal support zone (green) seen on the weekly time fame. Presently, it is in a bullish corrective mode, and we may see further bullish move, but we have some nearby barriers that may hinder a bullish drive. Personally, I will not be trading this pair until directional clarity or zone break is established.

Attached Image (click to enlarge)
Click to Enlarge

Name: EURUSDDaily_September 11, 2022.png
Size: 12 KB


EURUSD price action on the H4 time frame is in a corrective mode after a bearish retest of the 1.00810/0.99070 multi-year horizontal support zone (green) seen on the weekly time fame. Current technical pattern may lead to further northward move for liquidity grab but there is also the likelihood of a southward rotation to the 0.99070 area.

Attached Image (click to enlarge)
Click to Enlarge

Name: EURUSDH4_September 11, 2022.png
Size: 13 KB


I may be wrong. Trade safe and prosper.


KP
Do your homework, follow the footprints of smart money
 
 
  • Post #1,556
  • Quote
  • Sep 11, 2022 4:44pm Sep 11, 2022 4:44pm
  •  KeenPips
  • Joined Dec 2015 | Status: Member | 7,405 Posts
GBPUSD Weekly Technical Outlook

GBPUSD market operation on the weekly time frame retested the multi-year low around the 1.13970 (green) last week before yielding a bullish print. Although the technical structure is bearish, we may see further bullish market engineering.

Attached Image (click to enlarge)
Click to Enlarge

Name: GBPUSDWeekly_September 11, 2022.png
Size: 14 KB


GBPUSD price action on the daily time frame is in a bullish correction of a bearish technical structure after a bearish retest of the 1.13970 multi-year low. Further bullish move is favoured and we may see a drive towards the 1.17550/1.18620 horizontal resistance zone (red).

Attached Image (click to enlarge)
Click to Enlarge

Name: GBPUSDDaily_September 11, 2022.png
Size: 12 KB


GBPUSD price action on the H4 time frame has turned sideways after a bullish drive from the multi-year low around the 1.13970 (green). Recent technical prints give a slight edge to bulls, and we may see further northward move in the early part of this week.

Attached Image (click to enlarge)
Click to Enlarge

Name: GBPUSDH4_SEptember 11, 2022.png
Size: 12 KB


I may be wrong. Trade safe and prosper.

KP
Do your homework, follow the footprints of smart money
 
 
  • Post #1,557
  • Quote
  • Sep 18, 2022 3:49pm Sep 18, 2022 3:49pm
  •  KeenPips
  • Joined Dec 2015 | Status: Member | 7,405 Posts
XAUUSD Weekly Technical Outlook

XAUUSD market operation retained its bearish mode after dipping further into the 1683.15/1652.14 long-term horizontal support zone (green) last week.

Attached Image (click to enlarge)
Click to Enlarge

Name: GOLDWeekly_September 18, 2022.png
Size: 13 KB


XAUUSD price action on the daily time frame made a bullish pushback on Friday after further bearish surge into the 1683.15/1652.14 long-term horizontal support zone (green). But we may not see much northward move before a southward rotation.

Attached Image (click to enlarge)
Click to Enlarge

Name: GOLDDaily_September 18, 2022.png
Size: 13 KB


XAUUSD price action on the H4 time frame is in a bullish corrective mode. We can expect a bearish rotation after a bullish move to an area of value.

Attached Image (click to enlarge)
Click to Enlarge

Name: GOLDH4_September 18, 2022.png
Size: 12 KB


I may be wrong. Trade safe and prosper.

KP
Do your homework, follow the footprints of smart money
 
 
  • Post #1,558
  • Quote
  • Sep 18, 2022 4:05pm Sep 18, 2022 4:05pm
  •  KeenPips
  • Joined Dec 2015 | Status: Member | 7,405 Posts
USDJPY Weekly Technical Outlook

Although USDJPY market operation has posted multi-year highs, the bullish momentum is declining. On the weekly time frame, last week’s high is lower than the multi-year high posted two weeks ago. And there is increase in bearish pressure. The 139.280/138.500 zone (green) is still the prevailing horizontal support on the weekly time frame.

Attached Image (click to enlarge)
Click to Enlarge

Name: USDJPYWeekly_September 18, 2022.png
Size: 12 KB


After printing multi-year highs, USDJPY price action on the daily time frame is experiencing increasing bearish pressure. Presently, price action is in a sideway mode. We may see a bearish correction before further bullish drive. I am bullish the USDJPY but, as a medium-term swing trader, I will await a bearish correction to an area of value.

Attached Image (click to enlarge)
Click to Enlarge

Name: USDJPYDaily_September 18, 2022.png
Size: 12 KB


USDJPY price action on the H4 time frame is under a bullish technical environment but presently in a corrective mode. Personally, I expect further bearish decline before a resurgence of bullish momentum.

Attached Image (click to enlarge)
Click to Enlarge

Name: USDJPYH4_September 18, 2022.png
Size: 12 KB


I may be wrong. Trade safe and prosper.

KP
Do your homework, follow the footprints of smart money
 
1
  • Post #1,559
  • Quote
  • Sep 18, 2022 4:09pm Sep 18, 2022 4:09pm
  •  TheWolf
  • Joined May 2022 | Status: I'm Done | 2,577 Posts
Quoting KeenPips
Disliked
USDJPY Weekly Technical Outlook Although USDJPY market operation has posted multi-year highs, the bullish momentum is declining. On the weekly time frame, last week’s high is lower than the multi-year high posted two weeks ago. And there is increase in bearish pressure. The 139.280/138.500 zone (green) is still the prevailing horizontal support on the weekly time frame. {image} After printing multi-year highs, USDJPY price action on the daily time frame is experiencing increasing bearish pressure. Presently, price action is in a sideway mode. We...
Ignored
Just now stumbled on this forum. Good stuff! Thanks!
 
1
  • Post #1,560
  • Quote
  • Sep 18, 2022 4:21pm Sep 18, 2022 4:21pm
  •  KeenPips
  • Joined Dec 2015 | Status: Member | 7,405 Posts
GBPUSD Weekly Technical Outlook

GBPUSD market operation on the weekly time frame pushed to the 1.13413 all year low (green) having broken below the 1.13970 previous multi-year low. The bearish candlestick printed last week has shadows at both ends, but, significantly, the bottom shadow indicates that bulls are resisting further southward drive.

Attached Image (click to enlarge)
Click to Enlarge

Name: GBPUSDWeekly_Sunday 18, 2022.png
Size: 14 KB


GBPUSD price action on the daily time frame is experiencing a decline in bearish drive after creating an all time low at the 1.13413 area (green), breaking below the 1.13970 previous multi-year low. We may not see much bearish drive until a northward correction to an area of value, such as the 1.15960 area (red).

Attached Image (click to enlarge)
Click to Enlarge

Name: GBPUSDDaily_Sunday 18, 2022.png
Size: 12 KB


GBPUSD price action on the H4 time frame assumed a bullish corrective mode after printing an all time low at the 1.13413 area (green). We may see a northward market engineering to an area of value, such as the 1.15960 horizontal resistance area (red) or an area of market imbalance, before further southward drive.

Attached Image (click to enlarge)
Click to Enlarge

Name: GBPUSDH4_September 18, 2022.png
Size: 12 KB


I may be wrong. Trade safe and prosper.

KP
Do your homework, follow the footprints of smart money
 
 
  • Interactive Trading
  • /
  • Weekly Top-Down Technical Analyses
  • Reply to Thread
    • 1 7677Page 787980 84
    • 1 77Page 7879 84
0 traders viewing now
  • More
Top of Page
  • Facebook
  • Twitter
About FF
  • Mission
  • Products
  • User Guide
  • Media Kit
  • Blog
  • Contact
FF Products
  • Forums
  • Trades
  • Calendar
  • News
  • Market
  • Brokers
  • Trade Explorer
FF Website
  • Homepage
  • Search
  • Members
  • Report a Bug
Follow FF
  • Facebook
  • Twitter

FF Sister Sites:

  • Metals Mine
  • Energy EXCH
  • Crypto Craft

Forex Factory® is a brand of Fair Economy, Inc.

Terms of Service / ©2023