GBPUSD Weekly Technical Outlook
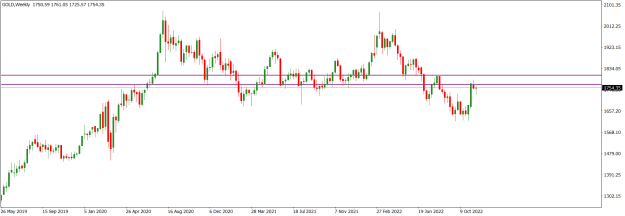
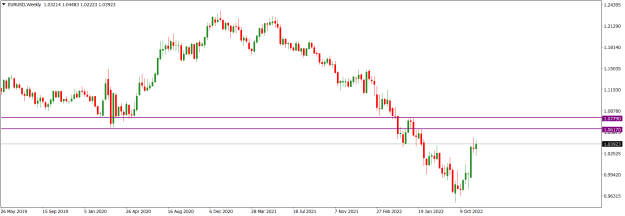
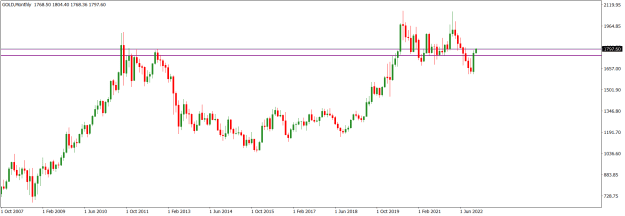
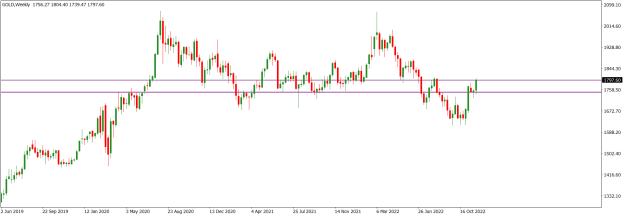
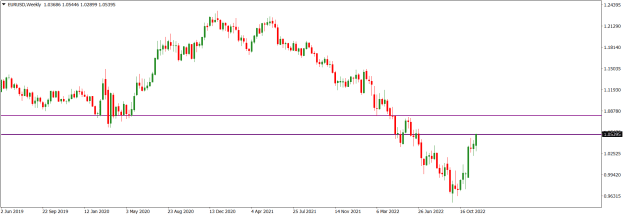
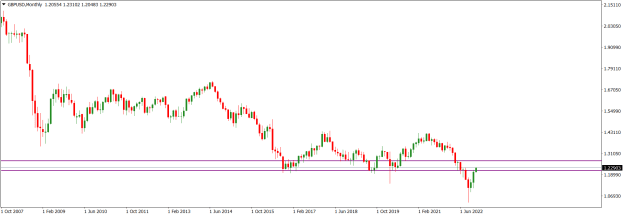
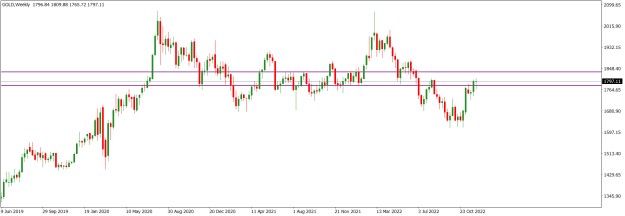
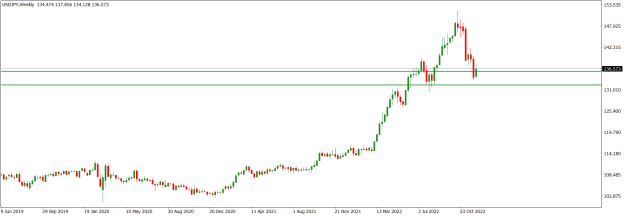
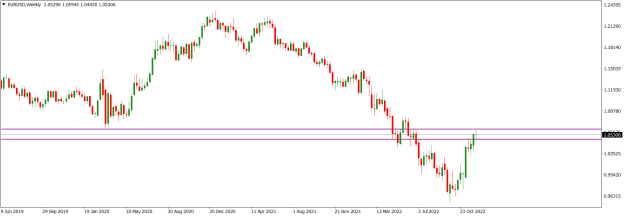
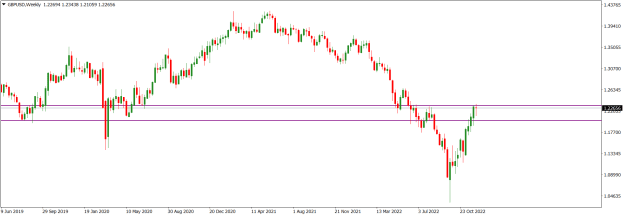
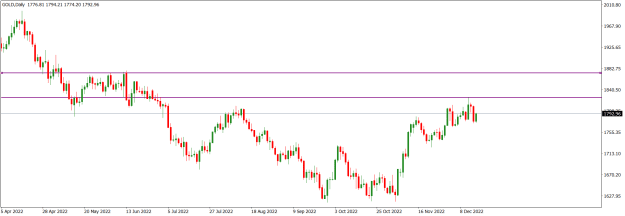
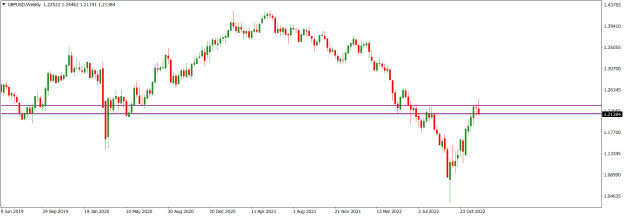
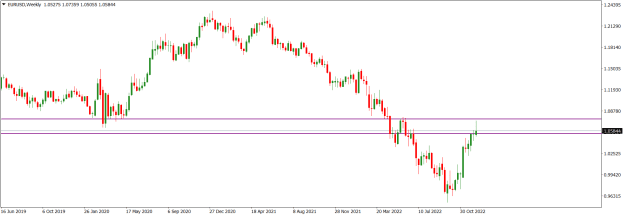
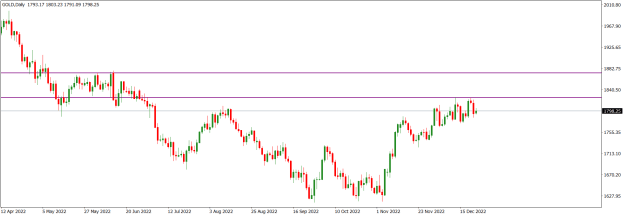
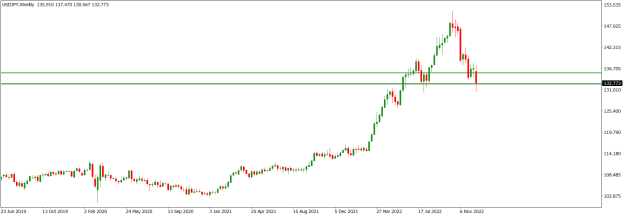
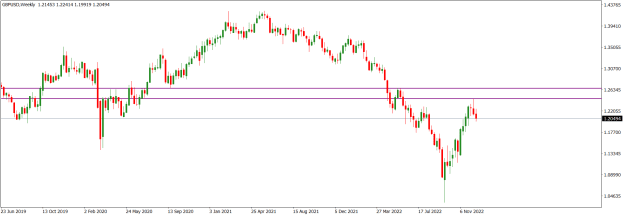
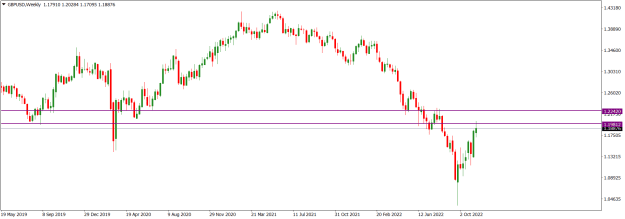
GBPUSD market operation is in a bullish corrective mode. On the weekly time frame, last week, market operation made a bullish retest of the 1.22420/1.19812 supply zone (purple) but failed to close within it, printing a top-shadow at the lower part of the zone. Although we may see another bullish attempt to penetrate the zone, a southward rotation seems to be imminent.
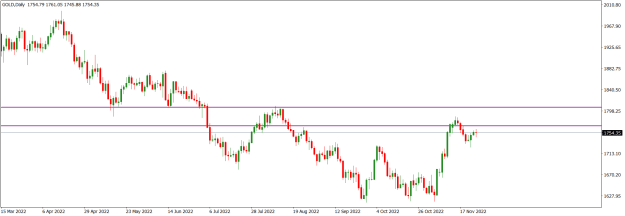
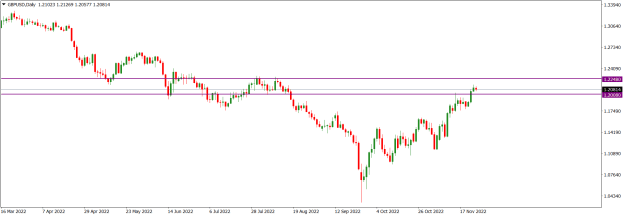
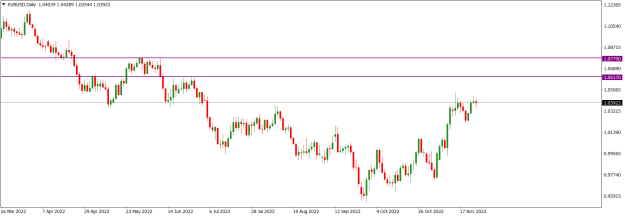
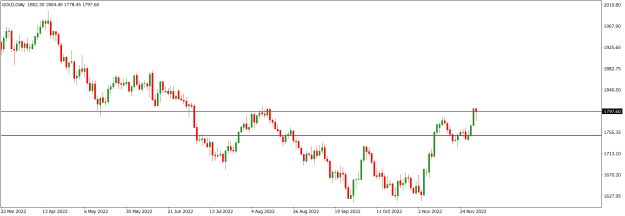
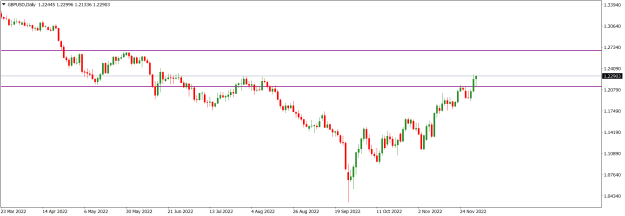
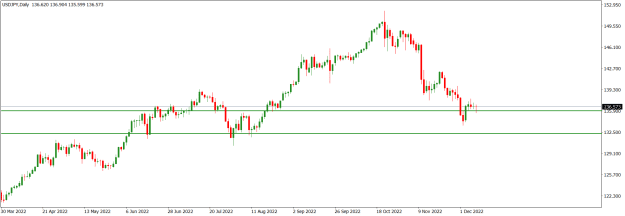
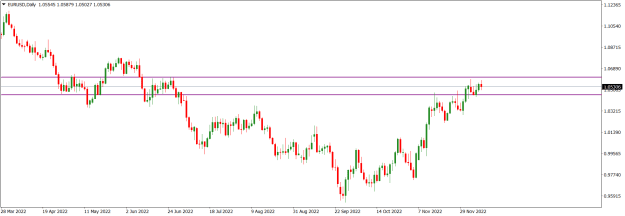
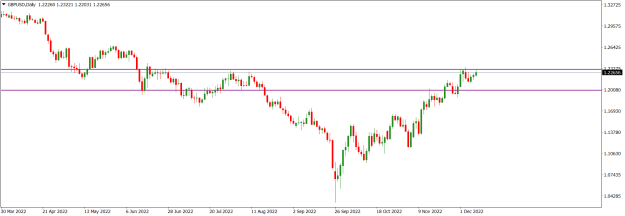
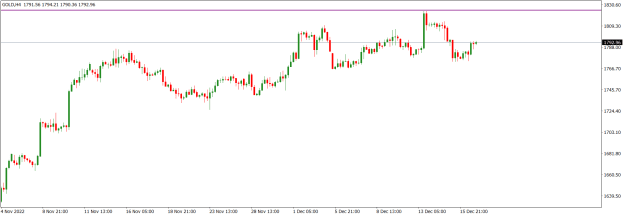
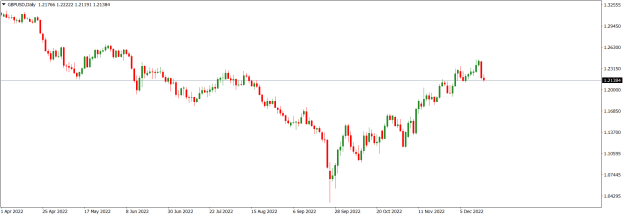
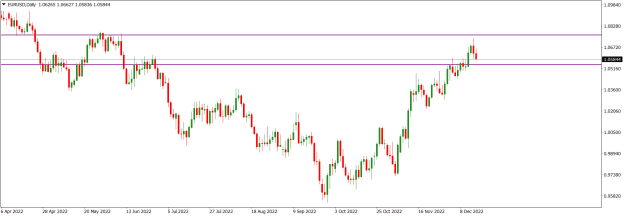
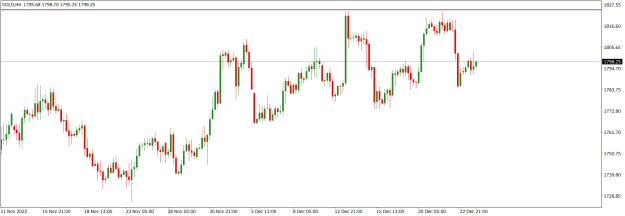
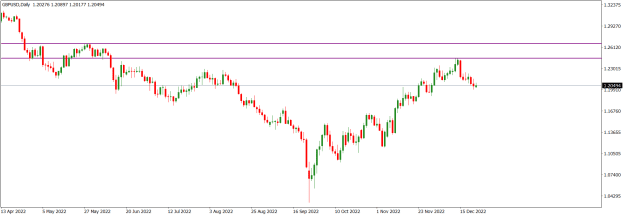
GBPUSD price action on the daily time frame is in a bullish corrective mode. Bullish price action tested the 1.22420/1.19812 weekly supply (purple) on Tuesday but failed to close within it. Although presently the price action is sideways, we may see a further northward move before a southward turnaround.
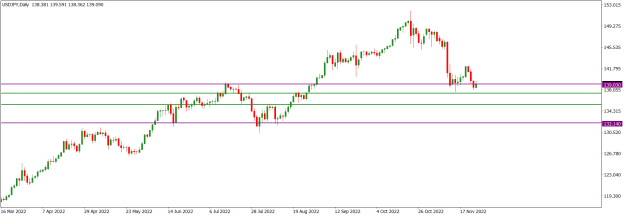
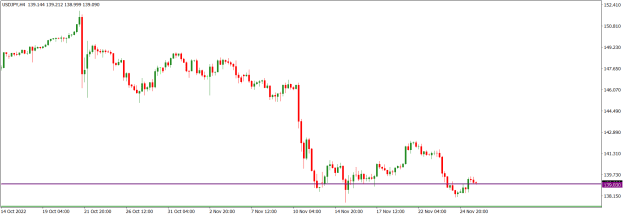
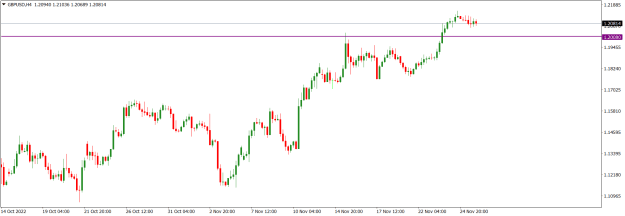
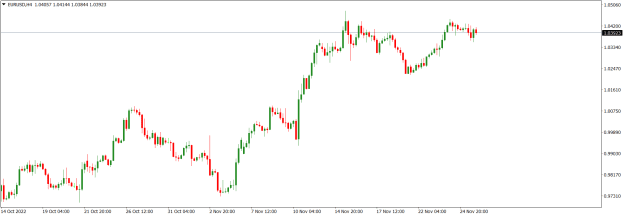
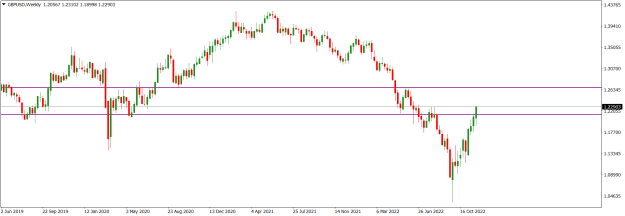
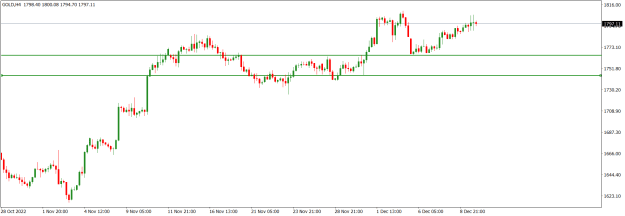
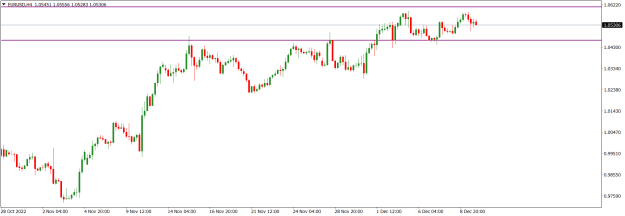
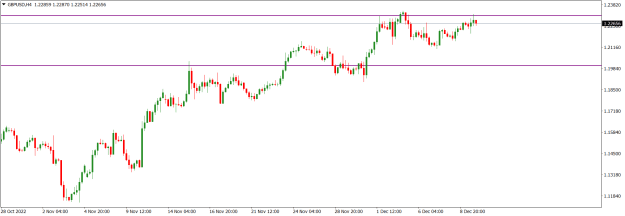
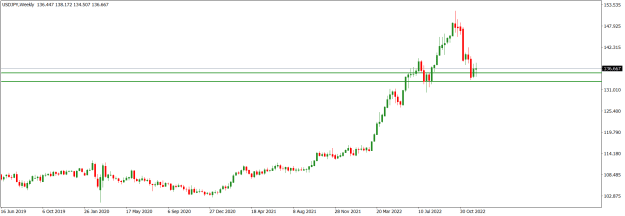
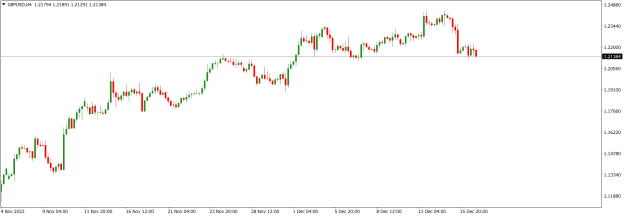
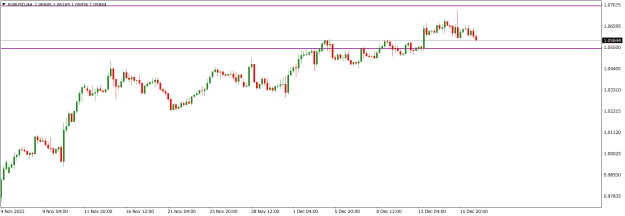
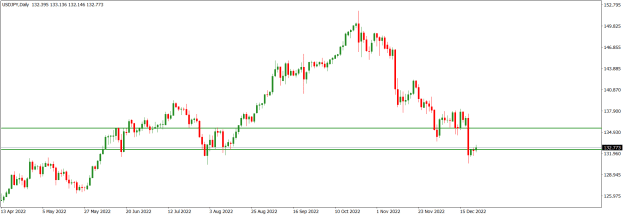
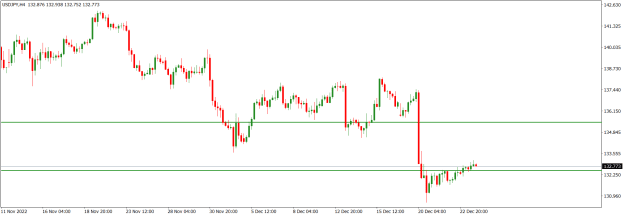
GBPUSD price action on the H4 time frame is in a sideway mode in the context of a bullish retracement as it retests the 1.22420/1.19812 weekly supply (purple). Although we may see further northward move, a southward turnaround appears to be imminent.

I may be wrong. Trade safe and prosper.
KP
GBPUSD market operation is in a bullish corrective mode. On the weekly time frame, last week, market operation made a bullish retest of the 1.22420/1.19812 supply zone (purple) but failed to close within it, printing a top-shadow at the lower part of the zone. Although we may see another bullish attempt to penetrate the zone, a southward rotation seems to be imminent.
Attached Image (click to enlarge)
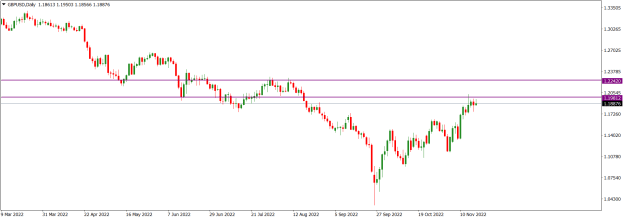
GBPUSD price action on the daily time frame is in a bullish corrective mode. Bullish price action tested the 1.22420/1.19812 weekly supply (purple) on Tuesday but failed to close within it. Although presently the price action is sideways, we may see a further northward move before a southward turnaround.
Attached Image (click to enlarge)
GBPUSD price action on the H4 time frame is in a sideway mode in the context of a bullish retracement as it retests the 1.22420/1.19812 weekly supply (purple). Although we may see further northward move, a southward turnaround appears to be imminent.
Attached Image (click to enlarge)
I may be wrong. Trade safe and prosper.
KP
Do your homework, follow the footprints of smart money