• Home
  • Forums
  • Trades
  • News
  • Calendar
  • Market
  • Brokers
  • Login
  • Join
  • User/Email: Password:
  • 10:05pm
Menu
  • Forums
  • Trades
  • News
  • Calendar
  • Market
  • Brokers
  • Login
  • Join
  • 10:05pm
Sister Sites
  • Metals Mine
  • Energy EXCH
  • Crypto Craft

Options

Bookmark Thread

First Page First Unread Last Page Last Post

Print Thread

Similar Threads

Major Pairs/Crosses - Trading Scenarios, Analyses & Forecasts 15 replies

Weekly/Monthly TOP Gainers Forexfactory Traders 4 replies

Long Term Analyses - EURUSD, GOLD, and S&P 76 replies

USD/CAD - Loonie Toons, & mostly pointless analyses 2 replies

Lazy analyses thread 56 replies

  • Interactive Trading
  • /
  • Reply to Thread
  • Subscribe
  • 3,656
Attachments: Weekly Top-Down Technical Analyses
Exit Attachments
Tags: Weekly Top-Down Technical Analyses
Cancel

Weekly Top-Down Technical Analyses

  • Last Post
  •  
  • 1 798081Page 8283 84
  • 1 81Page 8283 84
  •  
  • Post #1,621
  • Quote
  • Dec 25, 2022 4:29pm Dec 25, 2022 4:29pm
  •  KeenPips
  • Joined Dec 2015 | Status: Member | 7,405 Posts
EURUSD Weekly Technical Outlook

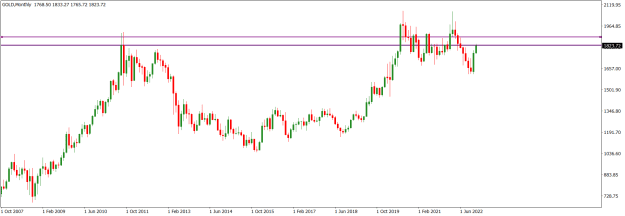
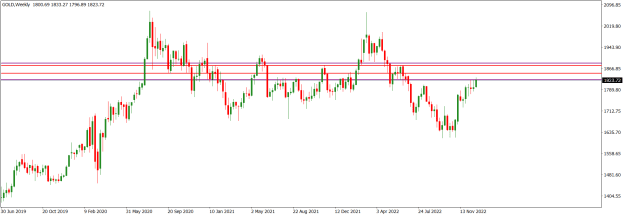
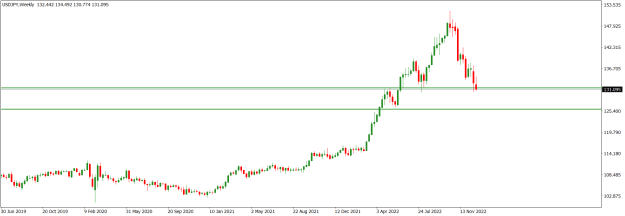
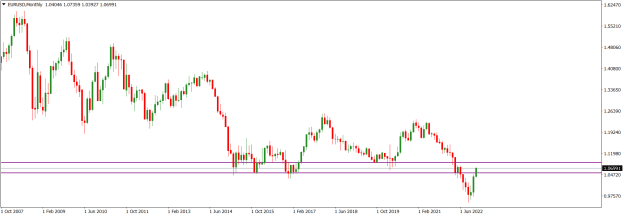
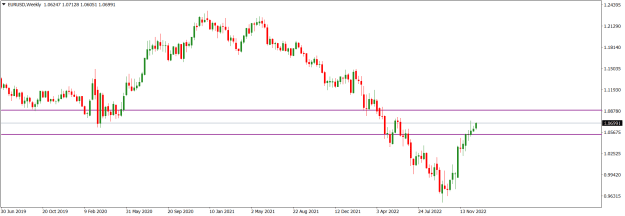
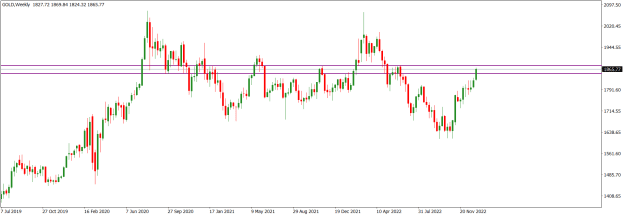
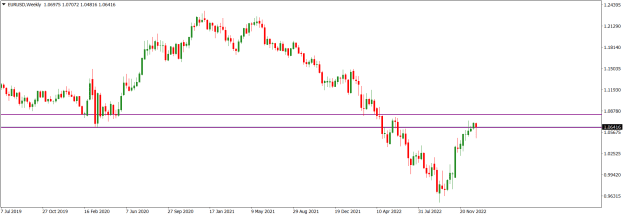
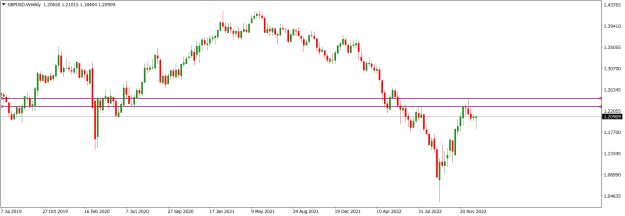
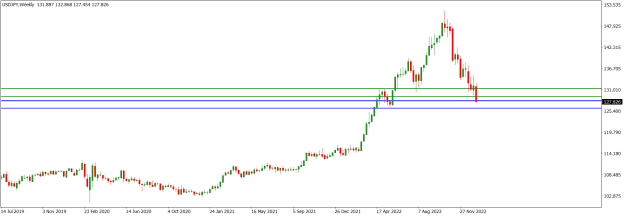
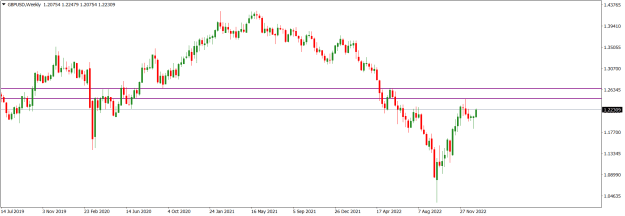
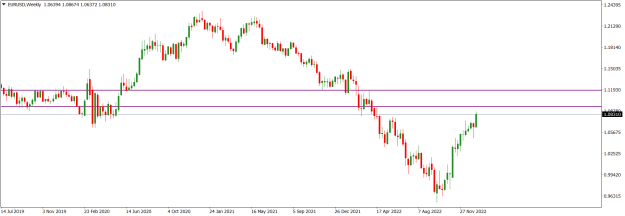
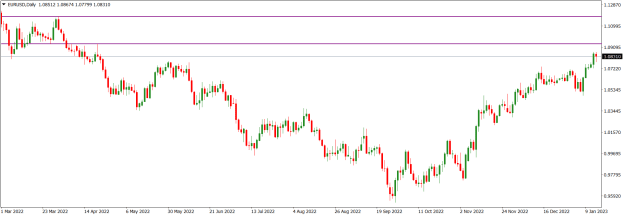
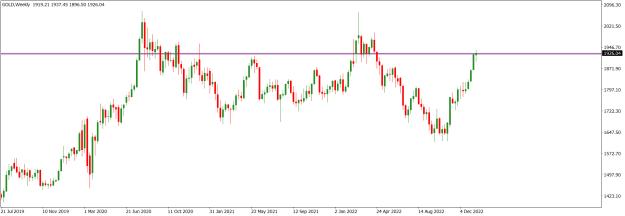
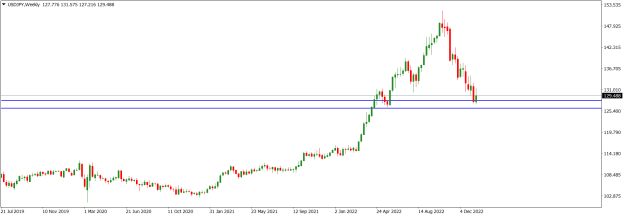
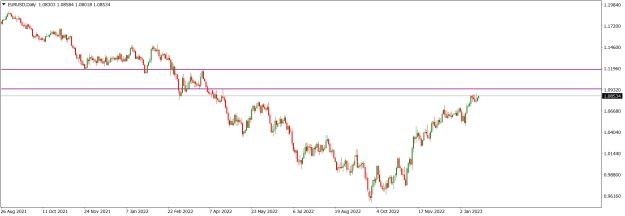
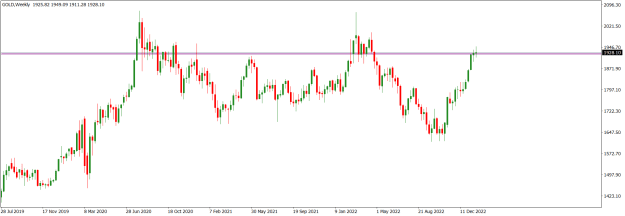
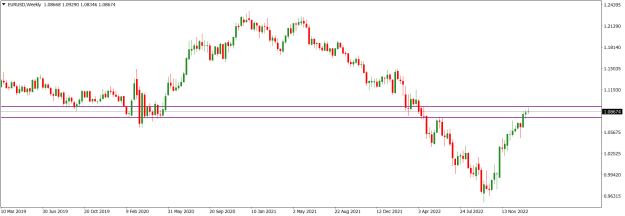
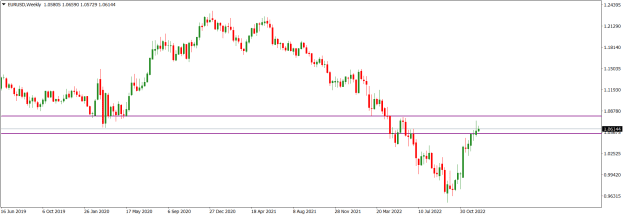
There is a decline in bullish momentum on the EURUSD market. On the weekly time frame, EURUSD market operation made a bullish retest of the 1.05420/1.08020 horizontal resistance zone (purple) but failed to follow through. Two weeks ago, the bullish print in the zone had a long upper shadow, indicating a relatively strong bearish challenge. Besides, last week’s bullish candlestick was miniature in size and was limited to the lower part of the zone. Apparently, market operation is finding it difficult to navigate further northward within the zone, which technically may incentivize a southward turnaround.

Attached Image (click to enlarge)
Click to Enlarge

Name: EURUSDWeekly.png
Size: 13 KB


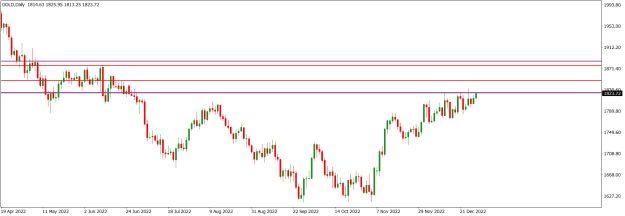
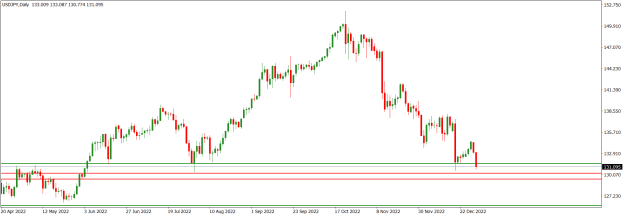
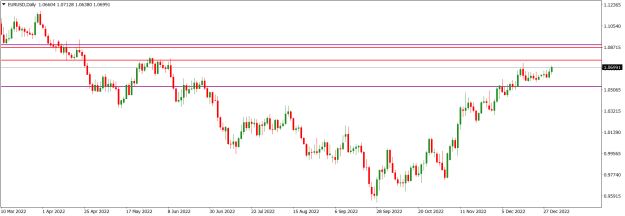
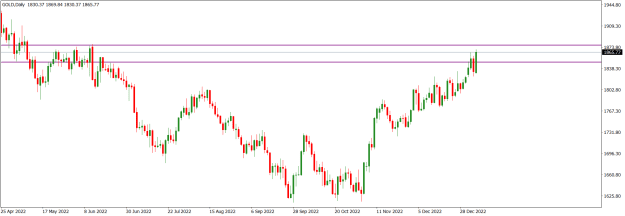
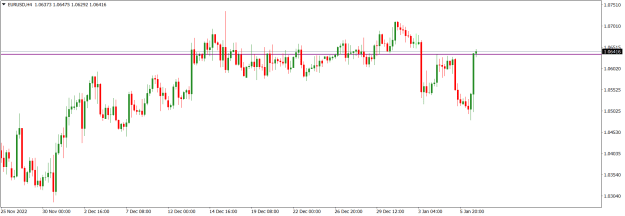
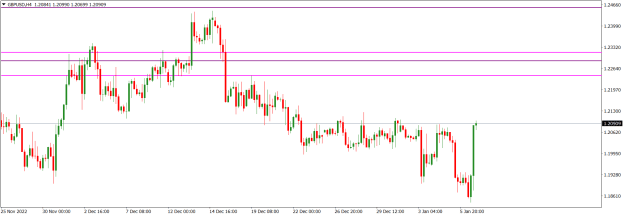
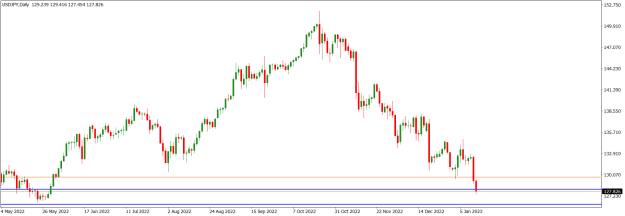
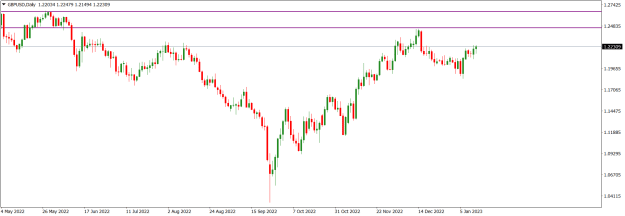
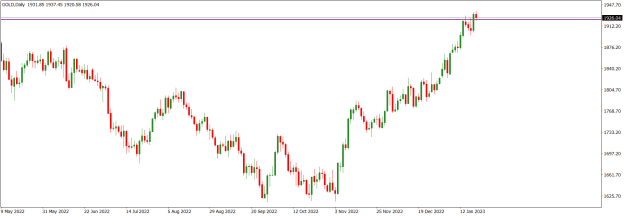
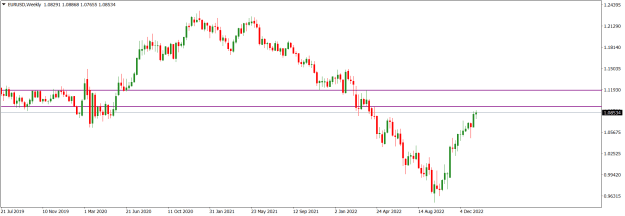
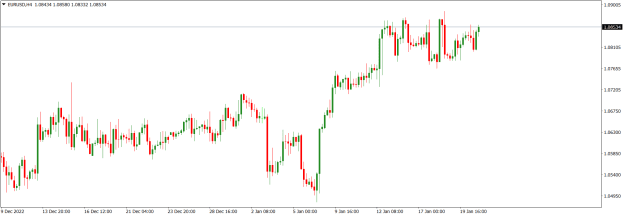
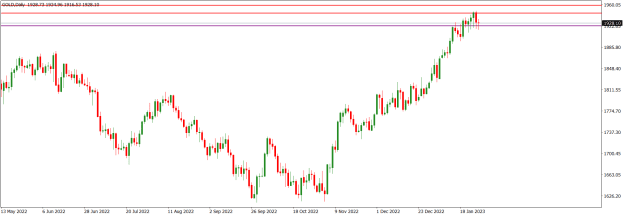
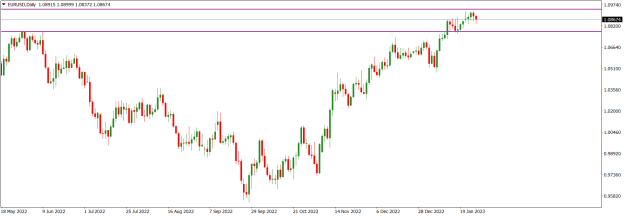
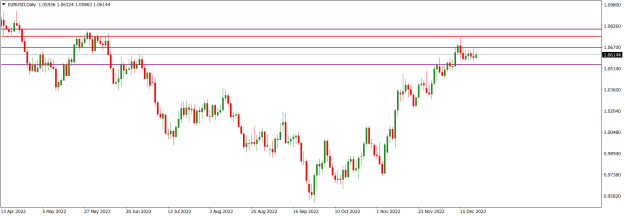
EURUSD price action met bearish rejection after making a bullish retest of the 1.07480/1.06670 supply (red) on the daily time frame, which is nestled in the 1.05420/1.08020 horizontal resistance zone (purple) seen on the weekly time frame. Presently, price action is sideways below the daily supply but within the lower part of the horizontal resistance zone seen on the weekly time. Technically, such a zone would imminently witness further bearish pushback, and this may lead to a southward turnaround.

Attached Image (click to enlarge)
Click to Enlarge

Name: EURUSDDaily.png
Size: 13 KB


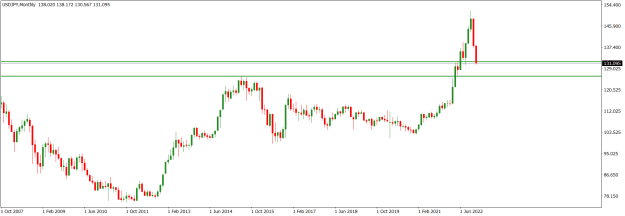
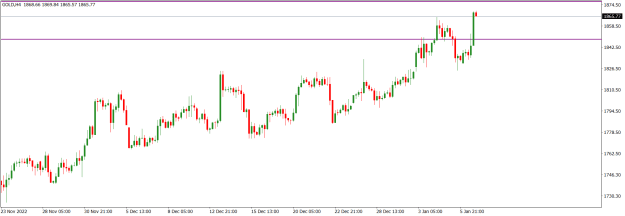
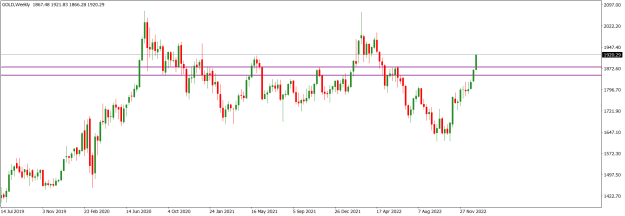
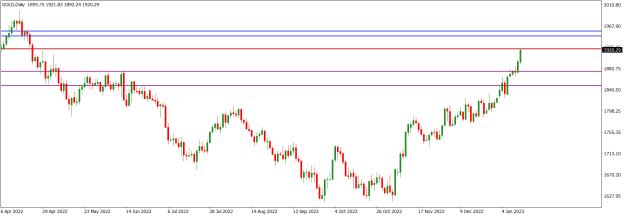
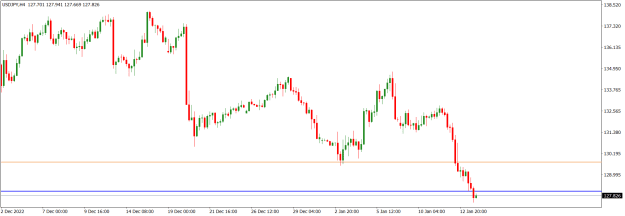
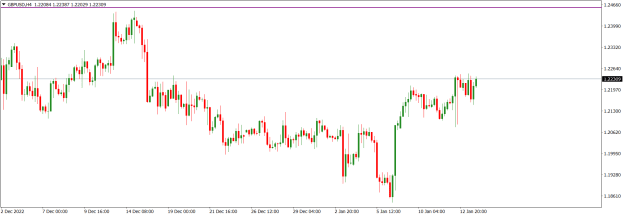
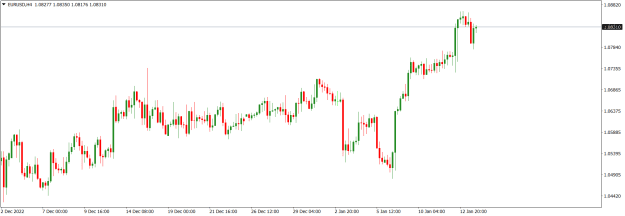
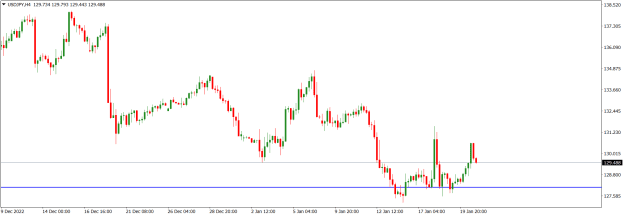
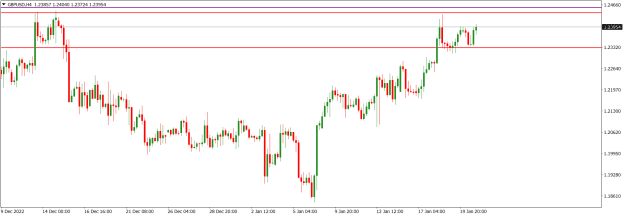
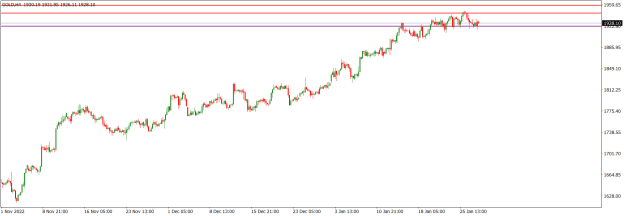
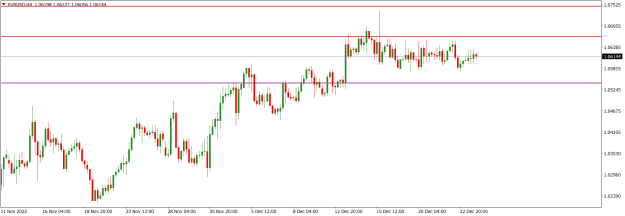
EURUSD price action on the H4 time frame has turned sideways after a bearish pushback as it navigates a confluence of daily and weekly resistance areas, and we may soon see a southward rotation.

Attached Image (click to enlarge)
Click to Enlarge

Name: EURUSDH4.png
Size: 12 KB


I may be wrong. Trade safe and prosper.

KP
Do your homework, follow the footprints of smart money
 
 
  • Post #1,622
  • Quote
  • Jan 1, 2023 2:42pm Jan 1, 2023 2:42pm
  •  KeenPips
  • Joined Dec 2015 | Status: Member | 7,405 Posts
XAUUSD Weekly Technical Outlook

XAUUSD market operation is in a bullish mode. In December, market operation printed a bullish corrective candlestick that pierced the lower boundary of the 1825.160/1885.100 horizontal resistance zone (purple).

Attached Image (click to enlarge)
Click to Enlarge

Name: GOLDMonthly.png
Size: 12 KB


XAUUSD market operation is in a bullish corrective mode on the weekly time frame. Last week, market operation printed a bullish candlestick that closed at the 129.430 area. Any further northward move may retest the 1876.850/1848.450 weekly supply (red), which is nestled in the 1825.160/1885.100 horizontal resistance zone (purple) seen on the monthly time frame.

Attached Image (click to enlarge)
Click to Enlarge

Name: GOLDWeekly.png
Size: 14 KB


XAUUSD price action on the daily time is making a grinding bullish corrective move towards a confluence of resistance zones. Presently it is at the lower boundary of a monthly horizontal resistance zone, and the technical pattern supports the possibility of further northward move. Such a move may retest the 1876.850/1848.450 daily supply area (red), which is confluence with the prevailing weekly supply. Nevertheless, we should not rule out bearish challenge as there are still some minor barriers to northward progression.

Attached Image (click to enlarge)
Click to Enlarge

Name: GOLDDaily.png
Size: 12 KB


I may be wrong. Trade safe and prosper.

KP
Do your homework, follow the footprints of smart money
 
 
  • Post #1,623
  • Quote
  • Jan 1, 2023 3:32pm Jan 1, 2023 3:32pm
  •  KeenPips
  • Joined Dec 2015 | Status: Member | 7,405 Posts
USDJPY Weekly Technical Outlook

USDJPY market operation has continued to dispose southward since November 2022. On the monthly time frame, in December, market operation printed a bearish candlestick that pierced the upper boundary of the 125.890/131.520 demand zone (green).

Attached Image (click to enlarge)
Click to Enlarge

Name: USDJPYMonthly.png
Size: 12 KB


USDJPY market operation on the weekly time frame is bearish. It is presently tackling the 125.890/131.520 demand zone (green) seen on the monthly time frame. The technical pattern and order flow context favour bears.

Attached Image (click to enlarge)
Click to Enlarge

Name: USDJPYWeekly.png
Size: 12 KB


USDJPY price action on the daily time frame is bearish. The technical pattern and order flow context favour further southward move. We may see a bearish drive to retest the 129.430/130.220 untested order block (red).

Attached Image (click to enlarge)
Click to Enlarge

Name: USDJPYDaily.png
Size: 13 KB


I may be wrong. Trade safe and prosper.

KP
Do your homework, follow the footprints of smart money
 
 
  • Post #1,624
  • Quote
  • Jan 1, 2023 4:09pm Jan 1, 2023 4:09pm
  •  KeenPips
  • Joined Dec 2015 | Status: Member | 7,405 Posts
GBPUSD Weekly Technical Outlook

GBPUSD market operation made a bullish retest of the 1.22140/1.26650 horizontal resistance zone (purple) in December. However, the bullish move met a bearish challenge, ending up printing an indecision candlestick that left a top-shadow at the lower part of the zone.

Attached Image (click to enlarge)
Click to Enlarge

Name: GBPUSDMonthly.png
Size: 11 KB


GBPUSD market operation on the weekly time frame turned sideways after a bullish retest of the 1.26650/1.24410 weekly supply (zone) met bearish pushback three weeks ago. The zone is nestled in the 1.22140/1.26650 horizontal resistance zone (purple) seen on the monthly time frame. Technically, northward market operation would find it difficult breaking out of such a zone. This may mean further sideways of market operation or increased bearish pushback.

Attached Image (click to enlarge)
Click to Enlarge

Name: GBPUSDWeekly.png
Size: 13 KB


GBPUSD price action on the daily time frame is consolidating. It made a bullish retest of the 1.23250/1.25000 horizontal resistance area (red) some days back and met a bearish rejection. Although we may still see a northward market engineering to a value area for liquidity grab, as the area is nestled in the 1.26650/1.24410 weekly supply zone, any bullish move would soon give way to a southward rotation.

Attached Image (click to enlarge)
Click to Enlarge

Name: GBPUSDDaily.png
Size: 12 KB


I may be wrong. Trade safe and prosper.

KP
Do your homework, follow the footprints of smart money
 
 
  • Post #1,625
  • Quote
  • Jan 1, 2023 4:36pm Jan 1, 2023 4:36pm
  •  KeenPips
  • Joined Dec 2015 | Status: Member | 7,405 Posts
EURUSD Weekly Technical Outlook

The EURUSD market operation made a bullish print in December. On the monthly time frame, the bullish market operation in December retested the 1.05310/1.08900 horizontal resistance zone (purple).

Attached Image (click to enlarge)
Click to Enlarge

Name: EURUSDMonthly.png
Size: 13 KB


EURUSD market operation on the weekly time frame is in a bullish mode as it tackles the 1.05310/1.08900 horizontal resistance zone (purple) seen on the monthly time frame. Although the recent candlestick prints have been small, the technical pattern still favours bulls more than bears.

Attached Image (click to enlarge)
Click to Enlarge

Name: EURUSDWeekly.png
Size: 13 KB


EURUSD price action on the daily time frame is bullish. The order flow and technicals favour bulls more than bears. We may still see further northward move, perhaps to retest the 1.08700/1.07590 daily supply zone (red) which is nestled in the 1.05310/1.08900 horizontal resistance zone (purple) seen on the monthly time frame.

Attached Image (click to enlarge)
Click to Enlarge

Name: EURUSDDaily.png
Size: 13 KB


I may be wrong. Trade safe and prosper.


KP
Do your homework, follow the footprints of smart money
 
 
  • Post #1,626
  • Quote
  • Jan 8, 2023 2:44pm Jan 8, 2023 2:44pm
  •  KeenPips
  • Joined Dec 2015 | Status: Member | 7,405 Posts
XAUUSD Weekly Technical Outlook

The XAUUSD market is presently bullish. On the weekly time frame, last week’s bullish print surged to the upper boundary of the 1848.450/1876.850 horizontal resistance zone (purple). The technical pattern and order flow context favour bulls.

Attached Image (click to enlarge)
Click to Enlarge

Name: GOLDWeekly.png
Size: 14 KB


XAUUSD price action on the daily time frame is bullish but it is presently tackling the 1848.450/1876.850 horizontal resistance zone (purple). Technicals still favour bulls.

Attached Image (click to enlarge)
Click to Enlarge

Name: GOLDDaily.png
Size: 13 KB


XAUUSD price action on the H4 time frame is bullish. Although some bearish pressure emerged at the last H4 session on Friday, recent technical prints favour bulls more than bears and we may still see further northward move.

Attached Image (click to enlarge)
Click to Enlarge

Name: GOLDH4.png
Size: 12 KB


I may be wrong. Trade safe and prosper.

KP
Do your homework, follow the footprints of smart money
 
 
  • Post #1,627
  • Quote
  • Jan 8, 2023 3:27pm Jan 8, 2023 3:27pm
  •  KeenPips
  • Joined Dec 2015 | Status: Member | 7,405 Posts
USDJPY Weekly Technical Outlook

USDJPY market operation on the weekly time frame made another bearish retest of the 131.300/129.100 horizontal support zone (green) last week but met a bullish pushback. However, as the bullish print of last week has shadows on both ends, we may still see further bearish pressure in the zone.

Attached Image (click to enlarge)
Click to Enlarge

Name: USDJPYWeekly.png
Size: 12 KB


USDJPY price action on the daily time frame turned sideways after a bullish pushback from the 131.300/129.100 horizontal support zone (green) seen on the weekly time frame. However, there is still some bearish pressure, and we may see another retest of the zone in the early part of this week.

Attached Image (click to enlarge)
Click to Enlarge

Name: USDJPYDaily.png
Size: 13 KB


USDJPY price action on the H4 time frame is disposed southward. Recent technical pattern favours bears more than bulls. And we may still see further southward move in the early part of this week.

Attached Image (click to enlarge)
Click to Enlarge

Name: USDJPYH4.png
Size: 14 KB


I may be wrong. Trade safe and prosper.

KP
Do your homework, follow the footprints of smart money
 
 
  • Post #1,628
  • Quote
  • Jan 8, 2023 4:22pm Jan 8, 2023 4:22pm
  •  KeenPips
  • Joined Dec 2015 | Status: Member | 7,405 Posts
EURUSD Weekly Technical Outlook

There is a decline in the bullish momentum recently seen in the EURUSD market. On the weekly time frame, the last few weeks have seen a decrease in the size of the bullish candlesticks printed as market operation attempts a retest of the 1.06350/1.08285 horizontal resistance zone (purple). Last week, market operation printed a long-tailed bearish candlestick that closed at the lower part of the zone, indicating that bears are being challenged by bulls.

Attached Image (click to enlarge)
Click to Enlarge

Name: EURUSDWeekly.png
Size: 13 KB


EURUSD price action on the daily time frame met bearish challenge as it retested the lower part of the 1.06350/1.08285 horizontal resistance zone (purple) seen on the weekly time frame. However, there was a bullish charge at the zone on Friday and we may see further northward move if bulls seize the initiative in the early part of this week.

Attached Image (click to enlarge)
Click to Enlarge

Name: EURUSDDaily.png
Size: 13 KB


EURUSD price action is disposed positively northwards. Although price action is tackling a major horizontal zone, we may still see further northward move in the early part of this week.

Attached Image (click to enlarge)
Click to Enlarge

Name: EURUSDH4.png
Size: 12 KB


I may be wrong. Trade safe and prosper.

KP
Do your homework, follow the footprints of smart money
 
 
  • Post #1,629
  • Quote
  • Jan 8, 2023 4:36pm Jan 8, 2023 4:36pm
  •  KeenPips
  • Joined Dec 2015 | Status: Member | 7,405 Posts
GBPUSD Weekly Technical Outlook

The bullish drive of GBPUSD market operation towards the 1.22880/1.24570 horizontal resistance zone (purple) six weeks ago met some bearish challenge. After a sideways of market operation, bulls made a further northward drive within the zone four weeks ago but there was a strong bearish pushback. Presently, on the weekly time frame, market operation is sideways within a supply area below the major horizontal resistance zone.

Attached Image (click to enlarge)
Click to Enlarge

Name: GBPUSDWeekly.png
Size: 13 KB


GBPUSD price action on the daily time frame went sideways after a bearish pushback from a bullish retest of the 1.22880/1.24570 horizontal resistance zone (purple) seen on the weekly time frame. Meanwhile, last Friday saw a bullish attempt to relaunch another northward move. Such a move may lead to a northward market engineering to an area of value before a southward rotation.

Attached Image (click to enlarge)
Click to Enlarge

Name: GBPUSDDaily.png
Size: 13 KB


GBPUSD price action on the H4 time frame is in a bullish mode. Recent technical pattern may incentivize a northward market engineering to an area of value, such as the 1.22420/1.23150 area of market imbalance (magenta).

Attached Image (click to enlarge)
Click to Enlarge

Name: GBPUSDH4.png
Size: 13 KB


I may be wrong. Trade safe and prosper.

KP
Do your homework, follow the footprints of smart money
 
 
  • Post #1,630
  • Quote
  • Jan 15, 2023 2:36pm Jan 15, 2023 2:36pm
  •  KeenPips
  • Joined Dec 2015 | Status: Member | 7,405 Posts
XAUUSD Weekly Technical Outlook

XAUUSD market operation continued its northward push last week after a bullish breakout of the 1848.45/1876.75 horizontal resistance zone (purple), which had been in place since June 2022. Meanwhile, XAUUSD market operation on the weekly time frame is testing the next horizontal resistance area, which is at the 1920.30 area.

Attached Image (click to enlarge)
Click to Enlarge

Name: GOLDWeekly.png
Size: 14 KB


XAUUSD price action on the daily time frame is technically bullish but it is presently tackling a horizontal resistance around the 1920.30 area (red). Should bulls retain their influence in the market we may see a northward push to an area of value such as the 1947.60/1957 order block (blue).

Attached Image (click to enlarge)
Click to Enlarge

Name: GOLDDaily.png
Size: 13 KB


XAUUSD price action on the H4 time frame remains in a bullish mode. The technical pattern and impulse still favour bulls more than bears.

Attached Image (click to enlarge)
Click to Enlarge

Name: GOLDH4.png
Size: 12 KB


I may be wrong. Trade safe and prosper.

KP
Do your homework, follow the footprints of smart money
 
 
  • Post #1,631
  • Quote
  • Jan 15, 2023 3:06pm Jan 15, 2023 3:06pm
  •  KeenPips
  • Joined Dec 2015 | Status: Member | 7,405 Posts
USDJPY Weekly Technical Outlook

USDJPY market operation continues to dispose southward. On the weekly time frame, last week, USDJPY market operation printed a bearish candlestick that broke down the 131.300/129.100 horizontal support (green). Presently, market operation is at the upper part of the 126.100/128.070 weekly demand (blue).

Attached Image (click to enlarge)
Click to Enlarge

Name: USDJPYWeekly.png
Size: 12 KB


USDJPY price action on the daily time frame broke down the 129.090 horizontal support (Sandybrown) on Friday. It is presently tackling the 128.070/126.100 horizontal support zone (blue), which has been in place since May 30, 2022. As the technical impulse is bearish, we may still see further southward move in the early part of this week.

Attached Image (click to enlarge)
Click to Enlarge

Name: USDJPYDaily.png
Size: 13 KB


On the H4 time frame, last Friday’s bearish push of USDJPY price action to the upper part of the 128.070/126.100 horizontal support zone (blue), seen on the daily time frame, met some bullish challenge. However, the technical impulse favours further bearish move.

Attached Image (click to enlarge)
Click to Enlarge

Name: USDJPYH4.png
Size: 13 KB


I may be wrong. Trade safe and prosper.

KP
Do your homework, follow the footprints of smart money
 
 
  • Post #1,632
  • Quote
  • Jan 15, 2023 3:30pm Jan 15, 2023 3:30pm
  •  KeenPips
  • Joined Dec 2015 | Status: Member | 7,405 Posts
GBPUSD Weekly Technical Outlook

GBPUSD market operation is bullish. However, there is a decline in bullish momentum. On the weekly time frame, last week, market operation printed a bullish candlestick which was a follow-up of the bullish pinbar printed two weeks ago. Market operation is presently at an order block with ‘top-wicky’ areas nearby – a technical situation that may incentivize further northward market engineering. The 1.26570/1.24570 zone (purple) is the operating supply.

Attached Image (click to enlarge)
Click to Enlarge

Name: GBPUSDWeekly.png
Size: 13 KB


GBPUSD price action on the daily time frame is bullish but declining in momentum. Nevertheless, the present location of price action has an area of value northward, which may incentivize further bullish move.

Attached Image (click to enlarge)
Click to Enlarge

Name: GBPUSDDaily.png
Size: 12 KB


GBPUSD price actin on the H4 time frame is sideways. However, looking left, there is an area of imbalance northward and some ‘wicky tops’ near a horizontal resistance area (purple) – which may incentivize further bullish charge.

Attached Image (click to enlarge)
Click to Enlarge

Name: GBPUSDH4.png
Size: 12 KB


I may be wrong. Trade safe and prosper.

KP
Do your homework, follow the footprints of smart money
 
 
  • Post #1,633
  • Quote
  • Jan 15, 2023 4:17pm Jan 15, 2023 4:17pm
  •  KeenPips
  • Joined Dec 2015 | Status: Member | 7,405 Posts
EURUSD Weekly Technical Outlook

EURUSD market operation continues to dispose northwards. On the weekly time frame, last week’s bullish print broke above a mini area of consolidation that was in place for two weeks. We may see further northward move should bulls sustain their influence in the market. The next major horizontal resistance is in the 1.09400/1.11820 zone (purple).

Attached Image (click to enlarge)
Click to Enlarge

Name: EURUSDWeekly_Jan 15, 2023.png
Size: 13 KB


EURUSD price action on the daily time frame is bullish but presently experiencing some bearish pressure. Nevertheless, the technical pattern favours bulls more than bears. Besides, price action is close to some northward area of value, including a nearby market imbalance, and this may incentivize northward market engineering. The next major horizontal resistance is in the 1.09400/1.11820 zone (purple).

Attached Image (click to enlarge)
Click to Enlarge

Name: EURUSDDaily_Jan 15, 2023.png
Size: 14 KB


EURUSD price action on the H4 time frame is presently sideways. However, the technical impulse favours bulls and we may see further northward move in the early part of this week.

Attached Image (click to enlarge)
Click to Enlarge

Name: EURUSDH4.png
Size: 12 KB


I may be wrong. Trade safe and prosper.

KP
Do your homework, follow the footprints of smart money
 
 
  • Post #1,634
  • Quote
  • Jan 22, 2023 3:02pm Jan 22, 2023 3:02pm
  •  KeenPips
  • Joined Dec 2015 | Status: Member | 7,405 Posts
XAUUSD Weekly Technical Outlook

XAUUSD market operation is bullish. On the weekly time frame, it is presently navigating the horizontal resistance at the 1922.535 area (purple) and so the bullish momentum has declined. Last week, market operation printed an indecision candlestick in the area.

Attached Image (click to enlarge)
Click to Enlarge

Name: GOLDWeekly.png
Size: 14 KB


XAUUSD price action on the daily time frame is presently tackling the 1922.535 horizontal resistance area (purple) seen on the weekly time frame. Last Friday saw bears pushing back further bullish surge. However, the bearish candlestick printed on Friday is relatively small, so we cannot rule out further northward move. Should bulls fail to regain momentum, we may see a bearish correction in the early part of this week.

Attached Image (click to enlarge)
Click to Enlarge

Name: GOLDDaily.png
Size: 13 KB


XAUUSD price action on the H4 time frame is sideways. Price action is navigating the 1922.535 horizontal resistance area (purple) seen on the weekly time frame and we should await directional clarity after further price action. Nevertheless, we cannot rule out a southward market engineering for liquidity grab before further bullish drive.

Attached Image (click to enlarge)
Click to Enlarge

Name: GOLDH4.png
Size: 12 KB


I may be wrong. Trade safe and prosper.

KP
Do your homework, follow the footprints of smart money
 
 
  • Post #1,635
  • Quote
  • Jan 22, 2023 3:34pm Jan 22, 2023 3:34pm
  •  KeenPips
  • Joined Dec 2015 | Status: Member | 7,405 Posts
USDJPY Weekly Technical Outlook

USDJPY market operation made a bearish charge at the 126.100/128.700 weekly demand zone (blue) two weeks ago. Last week, bulls strongly resisted the bearish move, but the long shadow on last week’s bullish print indicates that bears are still influential in the market.

Attached Image (click to enlarge)
Click to Enlarge

Name: USDJPYWeekly.png
Size: 12 KB


USDJPY price action on the daily time frame turned sideways after bulls resisted the bearish drive to the 126.100/128.700 weekly demand zone (blue). However, the recent ‘wicky tops’ indicate bears are still influential in the market and we cannot rule out further southward move in the early part of this week.

Attached Image (click to enlarge)
Click to Enlarge

Name: USDJPYDaily.png
Size: 13 KB


USDJPY price action on the H4 time frame is sideways. However, the technical impulse favours bears.

Attached Image (click to enlarge)
Click to Enlarge

Name: USDJPYH4.png
Size: 13 KB


I may be wrong. Trade safe and prosper.

KP
Do your homework, follow the footprints of smart money
 
 
  • Post #1,636
  • Quote
  • Jan 22, 2023 3:56pm Jan 22, 2023 3:56pm
  •  KeenPips
  • Joined Dec 2015 | Status: Member | 7,405 Posts
EURUSD Weekly Technical Outlook

Although EURUSD market operation is still bullish, there is a decline in bullish momentum. Last week, market operation printed a doji-like candlestick as market operation gets closer to the 1.09400/1.11820 horizontal resistance zone (purple).

Attached Image (click to enlarge)
Click to Enlarge

Name: EURUSDWeekly.png
Size: 13 KB


EURUSD price action on the daily time frame is sideways. Price action is approaching the lower boundary of the 1.09400/1.11820 horizontal resistance zone (purple) seen on the weekly time frame. As the technical impulse and the left-side ‘wicky tops’ favour bulls, we may see further northward move in the early part of the week.

Attached Image (click to enlarge)
Click to Enlarge

Name: EURUSDDaily.png
Size: 14 KB


EURUSD price action on the H4 time frame is ranging. However, the technical impulse favours bulls than bears.

Attached Image (click to enlarge)
Click to Enlarge

Name: EURUSDH4.png
Size: 12 KB


I may be wrong. Trade safe and prosper.

KP
Do your homework, follow the footprints of smart money
 
 
  • Post #1,637
  • Quote
  • Jan 22, 2023 4:24pm Jan 22, 2023 4:24pm
  •  KeenPips
  • Joined Dec 2015 | Status: Member | 7,405 Posts
GBPUSD Weekly Technical Outlook

GBPUSD market operation is bullish. On the weekly time frame, the bullish candlestick printed last week broke above a minor area of consolidation and threatened lower part of the 1.24570/1.26570 horizontal resistance zone (purple).

Attached Image (click to enlarge)
Click to Enlarge

Name: GBPUSDWeekly.png
Size: 13 KB


GBPUSD price action on the daily time frame is retesting the 1.23300/1.24400 daily supply area (red), which adjoins the lower part of the 1.24570/1.26570 horizontal resistance zone (purple) seen on the weekly time frame. Presently, there is a decline in bullish momentum, but we cannot rule out further northward market engineering in the early part of this week.

Attached Image (click to enlarge)
Click to Enlarge

Name: GBPUSDDaily.png
Size: 13 KB


GBPUSD price action on the H4 time frame turned sideways as it tackles the 1.23300/1.24400 daily supply area (red). Although technical impulse favours bulls, we may see a southward market engineering for liquidity grab before further bullish drive.

Attached Image (click to enlarge)
Click to Enlarge

Name: GBPUSDH4.png
Size: 12 KB


I may be wrong. Trade safe and prosper.

KP
Do your homework, follow the footprints of smart money
 
 
  • Post #1,638
  • Quote
  • Jan 29, 2023 2:56pm Jan 29, 2023 2:56pm
  •  KeenPips
  • Joined Dec 2015 | Status: Member | 7,405 Posts
XAUUSD Weekly Technical Outlook

XAUUSD market operation is technically bullish. However, on the weekly time frame, it is tackling the 1922.55 horizontal resistance area (purple). The last two weeks have seen a sideway of market operation in the area, as bears push back further bullish drive.

Attached Image (click to enlarge)
Click to Enlarge

Name: GOLDWeekly.png
Size: 14 KB


XAUUSD price action on the daily time frame broke above the 1922.55 horizontal resistance area (purple) and surged into the 1958.93/1944.93 supply zone (red), created on April 22, 2022, before it was pushed back by bears. Although last Friday’s print was doji-like, we may see another bullish test of the 1958.93/1944.93 supply zone (red) before a southward rotation.

Attached Image (click to enlarge)
Click to Enlarge

Name: GOLDDaily.png
Size: 13 KB


XAUUSD price action on the H4 time frame turned bearish after a bullish charge at the 1958.93/1944.93 daily supply zone (red), which was created on April 22, 2022. We may see another bullish attempt to retest the zone before a bearish rotation.

Attached Image (click to enlarge)
Click to Enlarge

Name: GOLDH4.png
Size: 13 KB


I may be wrong. Trade safe and prosper.

KP
Do your homework, follow the footprints of smart money
 
 
  • Post #1,639
  • Quote
  • Jan 29, 2023 3:23pm Jan 29, 2023 3:23pm
  •  KeenPips
  • Joined Dec 2015 | Status: Member | 7,405 Posts
USDJPY Weekly Technical Outlook

For the third week, USDJPY market operation on the weekly time frame has seen a bullish rejection of the 128.070/126.100 horizontal support zone (blue). Although last week’s print was doji-like, we may still see further bullish move this week.

Attached Image (click to enlarge)
Click to Enlarge

Name: USDJPYWeekly.png
Size: 12 KB


USDJPY price action on the daily time has rejected the 128.070/126.100 horizontal support (blue) seen on the weekly time frame but, presently, it is sideways. This could be seen as a technical pause before further northward market engineering to an area of value. Intra-day traders may be watching lower time frames for momentum shift in the early part of this week. Personally, as a medium-term swing trader, I will await the daily close on Monday, or a momentum shift on the H4 time frame, before looking for a trading opportunity.

Attached Image (click to enlarge)
Click to Enlarge

Name: USDJPYDaily.png
Size: 13 KB


USDJPY price action on the H4 time frame is presently sideways but the technical impulse favours bulls. We may see a northward momentum shift in the early part of the week.

Attached Image (click to enlarge)
Click to Enlarge

Name: USDJPYH4.png
Size: 12 KB


I may be wrong. Trade safe and prosper.

KP
Do your homework, follow the footprints of smart money
 
 
  • Post #1,640
  • Quote
  • Jan 29, 2023 4:17pm Jan 29, 2023 4:17pm
  •  KeenPips
  • Joined Dec 2015 | Status: Member | 7,405 Posts
EURUSD Weekly Technical Outlook

The EURUSD bullish momentum has declined. On the weekly time frame, EURUSD market operation has been tackling the 1.07800/1.0940 horizontal resistance zone (purple) since the past three weeks but could not breach it northwards. Rather, the last two weeks have seen market operation printing indecision candlesticks in the zone.

Attached Image (click to enlarge)
Click to Enlarge

Name: EURUSDWeekly.png
Size: 13 KB


On the daily time frame, EURUSD price action is experiencing increased bearish pressure as it tackles the 1.07800/1.0940 horizontal resistance zone (purple) seen on the weekly time frame. Should bears intensify their pressure, we may see further southward move in the early part of this week.

Attached Image (click to enlarge)
Click to Enlarge

Name: EURUSDDaily.png
Size: 13 KB


EURUSD price action on the H4 time frame is experiencing a bearish pushback as it tackles the 1.07800/1.0940 horizontal resistance zone (purple) seen on the weekly time frame. The recent technical pattern favours a southward market engineering for liquidity grab.

Attached Image (click to enlarge)
Click to Enlarge

Name: EURUSDH4.png
Size: 12 KB


I may be wrong. Trade safe and prosper.

KP
Do your homework, follow the footprints of smart money
 
 
  • Interactive Trading
  • /
  • Weekly Top-Down Technical Analyses
  • Reply to Thread
    • 1 798081Page 8283 84
    • 1 81Page 8283 84
0 traders viewing now
  • More
Top of Page
  • Facebook
  • Twitter
About FF
  • Mission
  • Products
  • User Guide
  • Media Kit
  • Blog
  • Contact
FF Products
  • Forums
  • Trades
  • Calendar
  • News
  • Market
  • Brokers
  • Trade Explorer
FF Website
  • Homepage
  • Search
  • Members
  • Report a Bug
Follow FF
  • Facebook
  • Twitter

FF Sister Sites:

  • Metals Mine
  • Energy EXCH
  • Crypto Craft

Forex Factory® is a brand of Fair Economy, Inc.

Terms of Service / ©2023