NOTE (Jan 31, 2014): Any indicators or EAs that I've contributed to this thread will probably no longer work in the latest MT4 build that is (if I understand correctly) due to be rolled out on Feb 3. If you want to ensure that these indicators/EAs continue to work correctly, do NOT upgrade your MT4 beyond the current build (509). I don't know how to re-code them to make them run correctly in the new look MT4, and I've no desire to re-educate myself to learn the new programming language that MetaQuotes is forcing upon everybody. Personally I think that their short-sighted development policy totally stinks, but there's nothing I can do about it. So if you decide to upgrade, you're on your own. Please note the Terms and Conditions below.
______________________
TERMS AND CONDITIONS
Please note that all code in this thread is supplied FREE of charge. Therefore the following conditions apply:
1. You agree that, if you download and use the code, it is ENTIRELY AT YOUR OWN RISK. I accept NO LIABILITY for any financial losses or computer related damage, caused by either the correct or incorrect use of the code.
2. Feel welcome to share the code freely, and modify any MQ4 source. However, you may NOT sell, or otherwise distribute, any part of the code commercially, without my prior written consent.
3. The code may not run correctly on Windows 7, Windows 8 or Vista, probably for the reasons given here.
4. I'm sorry, but due to my current work commitments, I am no longer modifying code to suit people’s personal requirements, nor posting replies to individual questions in this thread. (If you can’t get the code to work, you may find solutions already posted somewhere in the thread; otherwise, you’ll need to find another indicator).
_______________________
INSTRUCTIONS
Latest update: version 1.11, uploaded Sept 20, 2012
Latest changes to this post in red typeface
This is the most sophisticated support/resistance (S/R) indicator that I have created. It highlights some of the difficulties in translating what appears obvious to the technical analyst's naked eye, into a mathematical formula that can be coded. For better or worse, automating the S/R process introduces a level of objectivity: the indicator may pick up S/R zones that somehow escaped the analyst's view.
The indicator automatically plots horizontal S/R bands on your MT4 charts, according to the parameter settings that you enter. It does NOT plot any of diagonal trendlines, Fibo retracement levels, pivot levels or round numbers. Nonetheless, the indicator is highly configurable, necessitating a learning curve. Timeframe, bandwidth, frequency levels, visibility level & clearance can all be customized, resulting in very different S/R plots. Experiment with different parameter settings until you find the generated S/R bands approximating those that feel 'right' for you. For examples of how to set the parameters to plot 'salient', 'recent' and 'confluent' types of S/R, please see post #10.
Each S/R band plotted is actually an MT4 object (you can choose between rectangles or horizontal lines). You can have the indicator automatically maintain these on a going-forward basis, or simply have them plotted once, after which you can move or delete them, and/or add your own S/R. When you delete the indicator from the chart, all of the automatically generated bands are deleted also (if you set DeleteLinesOnDeinit to TRUE).
It is possible to have the bands generated according to candle data in one timeframe (TF), and then have these plotted on a different TF. Thus you could have H4 S/R levels being plotted, and 'locked in place', while you switch to different TFs (e.g. M5, M15, M30, etc). You can also specify which timeframe charts you wish to have the lines/boxes displayed, using the ShowOnTimeFrames parameter.
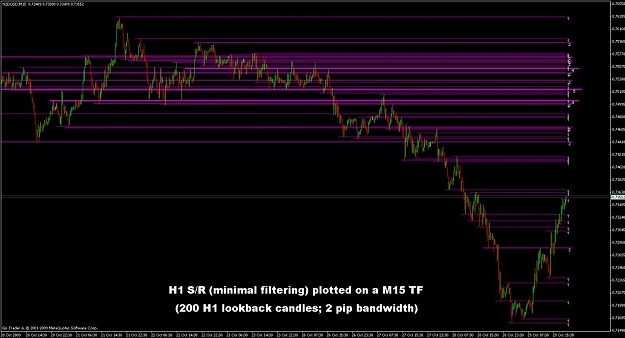
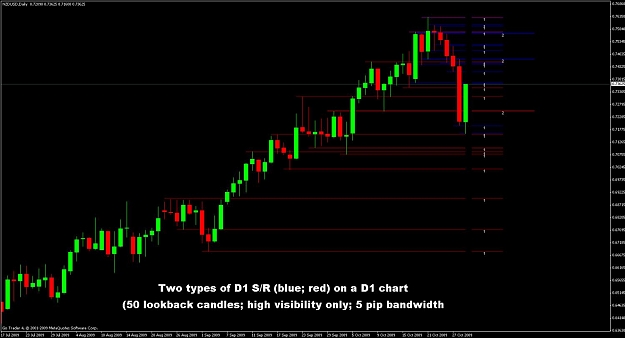
The bands may be plotted 'behind' the price candles in the 'body' of the chart, and/or as a frequency 'histogram' (showing how many times price reached each S/R band) in the empty space at the right of the chart. You can also optionally have the indicator plot a 'Market Profile' type histogram, showing how many times (candles) price traversed through each level. It can also be used to plot 'fractals' (local higher highs and lower lows). You can use different colors (or shades of a color) to highlight different frequencies.
If you want to have different 'types' of S/R represented on the same chart, then simply attach multiple instances of the indicator. For example, you could have high visibility, wider bandwidth, longer TF S/R plot in shades of one color, and lower visibility, narrow bandwidth, short TF S/R plot in shades of another. Or you could have (for example) monthly, weekly, daily and H4 S/R all plotted in different colors on the same chart, by attaching 4 different instances of the indicator.
You can see what the S/R would have looked like, at a prior point in time, by using the HistoricalShift parameter.
You can control the horizontal length of the lines/boxes using the LineOrBandLength parameter.
The indicator 're-paints' in the sense that as new S/R points are encountered, these (depending on your parameter settings) may not be created until all of your stipulated criteria have been met. Thus a currently displayed band that appears to have originated in the past might not have been displayed at that historical point. Since this indicator is unlikely to be used for generating entry signals, this should not be an issue.
Parameter settings may be entered either through MT4's dialog window, when you attach or edit the indicator, or via parameter file(s). You can create as many different parameter files as you wish, to maintain settings for different instances/uses of the indicator. Then when you attach the indicator, you need to enter only the ParameterFile name, and all other parameters are loaded from the file.
An output file may also optionally be generated, detailing the frequency of qualifying points at each S/R level. This file could then be used by an EA or imported to an application like Excel for further analysis.
I will possibly add an 'alerts' facility (when price reaches or approaches an S/R band) in a subsequent release.
INSTALLATION & USE
To install, download the Recent SR.ex4 file into your ..../experts/indicators folder, and (if you want to use the parameter file facilities) the Presets---Recent SR.txt file into your ..../experts/files folder. Then exit and restart MT4.
For operational instructions, please read the attached Word document.
Source code (.mq4 file) is now available. However, for it to compile correctly, you need to download the two .mqh files here into your .....(MT4)/experts/include folder.
CHANGE HISTORY
v 1.00: Initial release.
v 1.01: added new parameters: IncludeNextBandAbove, PlotProximityPips, HistoricalShift. See attached Word doc for detailed info.
v 1.02: VisibilityLevel parameter now also applies to candle closes.
v 1.03: added new parameter: DescriptionMask. See attached Word doc for detailed info.
v 1.04: added new parameters: ShowOnTimeFrames, VisCompletionRequired, which addresses the requests in posts #115 and #116. See attached Word doc for detailed info.
v 1.05: added new parameter: Plot Boxes. This now allows the plotting of the qualifying bands as either boxes (MT4 rectangle objects) or lines.
v 1.06:
1. Fixed bug where TimeFrame = MN (see post #131)
2. FilledBoxes now also determines line truncation (if PlotBoxes = false). See instruction document for details.
v 1.07:
1. Parameters PlotBoxes and FilledBoxes have now been replaced with new parameters LineWidth and Background. See the instructions document for more info. This also means that you may need to re-save any relevant MT4 templates.
2. New parameter UniqueID. See the instructions document for more info.
v 1.08:
1. New parameter LineOrBandLength. See the instructions document for more info.
2. Fixed bug: LineWidth parameter now works correctly if it is being set using a parameter file.
v 1.09:
1. New parameter DeleteLinesOnDeinit. See the instructions document for more info.
v 1.10:
1. Enhanced LineOrBoxLength parameter. See here for details.
v 1.11:
1. Output file now includes date/time of leftmost and rightmost QPs.
___________________________
MT4 Indicators/EAs by Hanover:
Recent Strength — display line-based plot of weighted average of currency (as opposed to pair) strength
Recent Prices — display line-based plots of any combo of pairs/timeframes on your current chart, to compare their relative strength
Recent Candles — display candles of any combo of pairs/timeframes on your current chart
Recent SR — auto-plot horizontal support/resistance lines based on a wide variety of settings
Recent News — display upcoming and/or historical news announcements from FF calendar; countdown/alert upcoming announcements
Daily Lines/Boxes — auto-plot horizontal or vertical lines, boxes, symbols on user-defined times, days of the week, etc
Display Info all pairs — display spread, daily range, dollars/pip, swap rates etc for all pairs
Spaced Lines — auto-plot horizontal lines on your charts
Stealth Master EA — hide your SL and TP from unscrupulous br0kers!
Do-it-yourself alerts builder kit — code template that you can copy/paste that will add pop-up and/or e-mail alerts to most 'standard' indicators
______________________
TERMS AND CONDITIONS
Please note that all code in this thread is supplied FREE of charge. Therefore the following conditions apply:
1. You agree that, if you download and use the code, it is ENTIRELY AT YOUR OWN RISK. I accept NO LIABILITY for any financial losses or computer related damage, caused by either the correct or incorrect use of the code.
2. Feel welcome to share the code freely, and modify any MQ4 source. However, you may NOT sell, or otherwise distribute, any part of the code commercially, without my prior written consent.
3. The code may not run correctly on Windows 7, Windows 8 or Vista, probably for the reasons given here.
4. I'm sorry, but due to my current work commitments, I am no longer modifying code to suit people’s personal requirements, nor posting replies to individual questions in this thread. (If you can’t get the code to work, you may find solutions already posted somewhere in the thread; otherwise, you’ll need to find another indicator).
_______________________
INSTRUCTIONS
Latest update: version 1.11, uploaded Sept 20, 2012
Latest changes to this post in red typeface
This is the most sophisticated support/resistance (S/R) indicator that I have created. It highlights some of the difficulties in translating what appears obvious to the technical analyst's naked eye, into a mathematical formula that can be coded. For better or worse, automating the S/R process introduces a level of objectivity: the indicator may pick up S/R zones that somehow escaped the analyst's view.
The indicator automatically plots horizontal S/R bands on your MT4 charts, according to the parameter settings that you enter. It does NOT plot any of diagonal trendlines, Fibo retracement levels, pivot levels or round numbers. Nonetheless, the indicator is highly configurable, necessitating a learning curve. Timeframe, bandwidth, frequency levels, visibility level & clearance can all be customized, resulting in very different S/R plots. Experiment with different parameter settings until you find the generated S/R bands approximating those that feel 'right' for you. For examples of how to set the parameters to plot 'salient', 'recent' and 'confluent' types of S/R, please see post #10.
Each S/R band plotted is actually an MT4 object (you can choose between rectangles or horizontal lines). You can have the indicator automatically maintain these on a going-forward basis, or simply have them plotted once, after which you can move or delete them, and/or add your own S/R. When you delete the indicator from the chart, all of the automatically generated bands are deleted also (if you set DeleteLinesOnDeinit to TRUE).
It is possible to have the bands generated according to candle data in one timeframe (TF), and then have these plotted on a different TF. Thus you could have H4 S/R levels being plotted, and 'locked in place', while you switch to different TFs (e.g. M5, M15, M30, etc). You can also specify which timeframe charts you wish to have the lines/boxes displayed, using the ShowOnTimeFrames parameter.
The bands may be plotted 'behind' the price candles in the 'body' of the chart, and/or as a frequency 'histogram' (showing how many times price reached each S/R band) in the empty space at the right of the chart. You can also optionally have the indicator plot a 'Market Profile' type histogram, showing how many times (candles) price traversed through each level. It can also be used to plot 'fractals' (local higher highs and lower lows). You can use different colors (or shades of a color) to highlight different frequencies.
If you want to have different 'types' of S/R represented on the same chart, then simply attach multiple instances of the indicator. For example, you could have high visibility, wider bandwidth, longer TF S/R plot in shades of one color, and lower visibility, narrow bandwidth, short TF S/R plot in shades of another. Or you could have (for example) monthly, weekly, daily and H4 S/R all plotted in different colors on the same chart, by attaching 4 different instances of the indicator.
You can see what the S/R would have looked like, at a prior point in time, by using the HistoricalShift parameter.
You can control the horizontal length of the lines/boxes using the LineOrBandLength parameter.
The indicator 're-paints' in the sense that as new S/R points are encountered, these (depending on your parameter settings) may not be created until all of your stipulated criteria have been met. Thus a currently displayed band that appears to have originated in the past might not have been displayed at that historical point. Since this indicator is unlikely to be used for generating entry signals, this should not be an issue.
Parameter settings may be entered either through MT4's dialog window, when you attach or edit the indicator, or via parameter file(s). You can create as many different parameter files as you wish, to maintain settings for different instances/uses of the indicator. Then when you attach the indicator, you need to enter only the ParameterFile name, and all other parameters are loaded from the file.
An output file may also optionally be generated, detailing the frequency of qualifying points at each S/R level. This file could then be used by an EA or imported to an application like Excel for further analysis.
I will possibly add an 'alerts' facility (when price reaches or approaches an S/R band) in a subsequent release.
INSTALLATION & USE
To install, download the Recent SR.ex4 file into your ..../experts/indicators folder, and (if you want to use the parameter file facilities) the Presets---Recent SR.txt file into your ..../experts/files folder. Then exit and restart MT4.
For operational instructions, please read the attached Word document.
Source code (.mq4 file) is now available. However, for it to compile correctly, you need to download the two .mqh files here into your .....(MT4)/experts/include folder.
CHANGE HISTORY
v 1.00: Initial release.
v 1.01: added new parameters: IncludeNextBandAbove, PlotProximityPips, HistoricalShift. See attached Word doc for detailed info.
v 1.02: VisibilityLevel parameter now also applies to candle closes.
v 1.03: added new parameter: DescriptionMask. See attached Word doc for detailed info.
v 1.04: added new parameters: ShowOnTimeFrames, VisCompletionRequired, which addresses the requests in posts #115 and #116. See attached Word doc for detailed info.
v 1.05: added new parameter: Plot Boxes. This now allows the plotting of the qualifying bands as either boxes (MT4 rectangle objects) or lines.
v 1.06:
1. Fixed bug where TimeFrame = MN (see post #131)
2. FilledBoxes now also determines line truncation (if PlotBoxes = false). See instruction document for details.
v 1.07:
1. Parameters PlotBoxes and FilledBoxes have now been replaced with new parameters LineWidth and Background. See the instructions document for more info. This also means that you may need to re-save any relevant MT4 templates.
2. New parameter UniqueID. See the instructions document for more info.
v 1.08:
1. New parameter LineOrBandLength. See the instructions document for more info.
2. Fixed bug: LineWidth parameter now works correctly if it is being set using a parameter file.
v 1.09:
1. New parameter DeleteLinesOnDeinit. See the instructions document for more info.
v 1.10:
1. Enhanced LineOrBoxLength parameter. See here for details.
v 1.11:
1. Output file now includes date/time of leftmost and rightmost QPs.
___________________________
MT4 Indicators/EAs by Hanover:
Recent Strength — display line-based plot of weighted average of currency (as opposed to pair) strength
Recent Prices — display line-based plots of any combo of pairs/timeframes on your current chart, to compare their relative strength
Recent Candles — display candles of any combo of pairs/timeframes on your current chart
Recent SR — auto-plot horizontal support/resistance lines based on a wide variety of settings
Recent News — display upcoming and/or historical news announcements from FF calendar; countdown/alert upcoming announcements
Daily Lines/Boxes — auto-plot horizontal or vertical lines, boxes, symbols on user-defined times, days of the week, etc
Display Info all pairs — display spread, daily range, dollars/pip, swap rates etc for all pairs
Spaced Lines — auto-plot horizontal lines on your charts
Stealth Master EA — hide your SL and TP from unscrupulous br0kers!
Do-it-yourself alerts builder kit — code template that you can copy/paste that will add pop-up and/or e-mail alerts to most 'standard' indicators
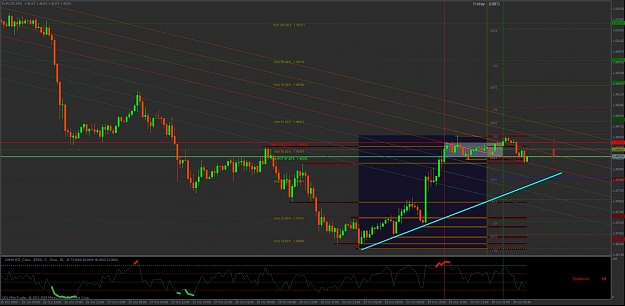
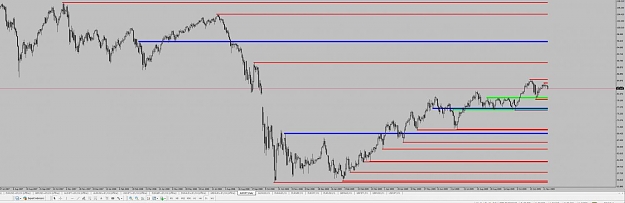
Attached Image(s) (click to enlarge)
Attached File(s)