______________________
TERMS AND CONDITIONS
Please note that all code in this thread is supplied FREE of charge. Therefore the following conditions apply:
1. You agree that, if you download and use the code, it is ENTIRELY AT YOUR OWN RISK. I accept NO LIABILITY for any financial losses or computer related damage, caused by either the correct or incorrect use of the code.
2. Feel welcome to share the code freely, and modify any MQ4 source. However, you may NOT sell, or otherwise distribute, any part of the code commercially, without my prior written consent.
3. The code may not run correctly on Windows 7, Windows 8 or Vista, probably for the reasons given here.
4. I'm sorry, but due to my current work commitments, I am no longer modifying code to suit people’s personal requirements, nor posting replies to individual questions in this thread. (If you can’t get the code to work, you may find solutions already posted somewhere in the thread; otherwise, you’ll need to find another indicator).
_______________________
INSTRUCTIONS
Latest update: version 1.06, uploaded Sept 2, 2010
Latest changes to this post in red typeface
Disclaimer: The attached indicator is supplied 'as is', free of charge. No warranty or obligation of support is implied. Download and use it at your own risk. I hope that you find it useful. It's the initial v1.0 release, please feel welcome to post questions, and report any bugs or shortcomings in this thread.
Note (May 25, 2010): Please take the opportunity to download this indicator while it's still available for free. I will soon be applying to become a commercial member.
_____________________
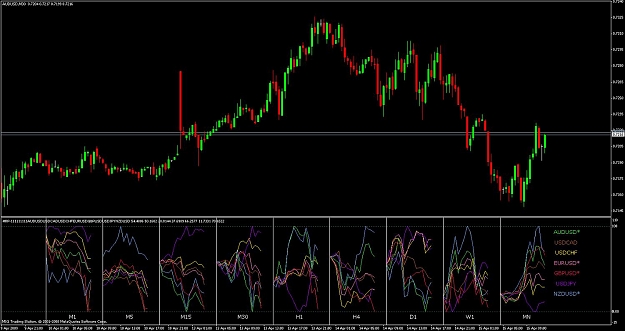
This is the third of the 'Three Musketeers' - Recent Candles, Recent Strength and now Recent Prices. The latter allows you to overlay the closing prices of up to 8 pairs on the same chart. Any or all of the nine MT4 timeframes are selectable. See the screenshot below.
To install, unzip the attached Unzip into experts_files folder.zip file into the ...../experts/files folder; copy the attached Recent Prices.ex4 file into the .....expertsindicators folder, and then restart MT4. Press Ctrl-N to open the Navigator, and drag the indicator (under the 'Custom Indicators' tree) onto your chart. Set the parameters to suit (see the 'PARAMETERS' section below), and click OK.
You can set the parameters either by using MT4's built-in dialog, when you attach the indicator; or by overriding these settings using the Presets---Recent Prices.TXT file (use a text editor like Notepad to view/edit the file). Using the file allows you to save preset values, retaining them for each future time you attach the indicator. To disable an entry in the file, start the line with two slashes (//). To re-enable it, remove the slashes. You may use any number of embedded spaces or underscores, and/or any combo of upper or lower case, to aid readability, however you wish. Every line MUST end with a semi-colon (; ). To save typing and improve accuracy, copy/paste the sample lines in the file. To disable the entire file, rename it, or delete its content; if the file doesn't exist, the Parameter Dialog entries (when you attach/edit the indicator) will be used. To have any changes take immediate effect, either (1) re-attach the indicator to your chart; (2) edit the indicator (press Ctrl-I); or (3) toggle between timeframes.
To expand/compress the plot(s) horizontally, zoom in/out using the +/– keys.
To expand/compress the plot(s) vertically, drag the window separator upward/downward.
The calculation works as follows. Each colored line represents a given pair (see legend at right of chart). The ratio of each candle's closing price is compared to the closing price of the BasePoint candle. The pair of the parent chart (the chart to which the indicator is attached) is used to align candle times of the pairs, to help work around the potential problem of missing data. You can invert the plot (e.g. plot an effective USDGBP instead of GBPUSD) of an individual pair by entering a negative Style value (see the 'PARAMETERS' section for more info). If the SmoothingSMA parameter (see below) is set to a value > 1, then additional prior points are used to smooth the initial values being plotted. Finally the values are then re-scaled to a value between 0 and 100 (relative to ALL values being plotted in a given timeframe).
Note that the accuracy of the plots is restricted to the pairs, and the data (on each pair/timeframe), provided by your broker. Missing data will result in an inaccurate curve being plotted. Use MT4's history center (press F2) and/or temporarily view charts of relevant pairs/timeframes (use the PageUp key to add more data to the left of the chart) to gather more data for plotting. Amongst MT4 brokers, www.migfx.com is one candidate whose MT4 provides ALL possible 28 pair combos involving the major currencies (AUD, CAD, CHF, EUR, GBP, JPY, NZD, USD) from which to gather data (this is not necessarily an endorsement to trade with them, though).
The pairs being plotted are shown in the legend at the right of the plots. An asterisk (*) means that the plot has been inverted for that pair. In the screenshot below, the plots of AUDUSD, EURUSD, GBPUSD and NZDUSD have all been inverted, so that for each pair, a rising plot denotes a strengthening USD, and a falling plot a weakening USD. Hence you can see which pairs are outperforming, or underperforming, USD on all timeframes.
PARAMETERS
- CurrencyFile – enter the file extension XXX (where XXX = AUD, CAD, CHF, EUR, GBP, JPY, NZD or USD). This will cause the file Presets---Recent Prices.XXX to be used instead of Presets---Recent Prices.TXT, allowing you to have a different set of presets for each currency. Sample files may be unzipped from the attached ZIP into your ...../experts/files folder. In typing the symbol, upper/lowercase may be used interchangeably (e.g. USD or usd). You may also use any of the following abbreviations: A=AUD; C=CAD; E=EUR; F=CHF; G=GBP; J=JPY; N=NZD; U=USD; H=HKD; S=SGD; Z=ZAR. So you could type G or g instead of GBP, for example. If the currency typed is not 1 character, the abbreviation will not be recognized
- TimeFrames – select the timeframes you wish to see, separated by commas. If displaying only one timeframe, a trailing comma is not required. Leaving this parameter blank defaults to the timeframe of the chart to which the indicator is attached. The spaces are optional, and are included merely for clarity. Upper/lowercase may be used interchangeably (e.g. H1 or h1). Time frames will display in the left-to-right order in which you type them. Reducing the number of timeframes will improve computer performance
- NumPoints – how many points (candles) back from the currently forming one, that you want to see. For example, to see the currently forming data point, and also the last 3 points, type 3. Typing a single value will display that number of candles for all timeframes. Typing multiple values, separated by commas, allows a different number of candles for each timeframe (by matching the NumPoints entry with the corresponding TimeFrames entry). The above creates a rolling window of the last 'n' candles. Alternatively, you can specify a fixed starting point, and thus have a progressively growing window of data points. To achieve this, enter the starting point in any of these forms: (1) YYYY.MM.DD HH:MM or (2) YYYY.MM.DD (this assumes starting from MT4 midnight at the specified date) or (3) HH:MM (this will start from the specified MT4 time, today, after it has been reached) or (4) any of these timeframes M5, M15, M30, H1, H4, D1, W1, MN (this will create a window that exists for the life of the timeframe, and then restarts over again, on the first tick of the next occurrence of that timeframe). As with the number of candles, you may specify a different starting point for each timeframe
- BasePoint – the 'anchor' point used as a reference, from which all ratios are calculated, counting back from the rightmost candle. A negative value means that BasePoint will be set equal to NumPoints, i.e. the leftmost point is also the base point. A zero value means that the rightmost point is the base point. Typing a single value will display that BasePoint for all timeframes. Typing multiple values, separated by commas, allows a different BasePoint for each timeframe (by matching the BasePoint entry with the corresponding TimeFrames entry). This works the same as in Recent Strength - See the illustrative example screenshots here
- HistoricalShift – enter 0 to display the current plot. Enter a positive number to display the plot as it would have looked X points (candles) ago. Typing a single value will display that HistoricalShift for all timeframes. Typing multiple values, separated by commas, allows a different HistoricalShift for each timeframe (by matching the HistoricalShift entry with the corresponding TimeFrames entry). This will likely be necessary, e.g. to see the plots as they were 4 hours ago, you'd need to type 1,4,8,16,48 for the H4,H1,M30,M15,M5 timeframes, respectively
- SmoothingSMA – applies a simple moving average (SMA) to smooth the data being plotted. Default value of 1 effectively means no smoothing. The larger the value, the greater the smoothness (and the clearer the view), but the greater the lag. Applies to all selected currencies and timeframes. The sum of NumPoints + SmoothingSMA must NOT exceed 2,000
- SetBaseCurrency – leave blank for a 'normal' plot. Otherwise, type in the symbol of one of the pairs plotted, to have that pair's plot appear as a horizontal line (zero point), and all of the other pairs' plots re-scaled relative to that pair. In typing the symbol, upper/lowercase may be used interchangeably (e.g. USDCHF or usdchf). Permissible abbreviations are: A=AUD; C=CAD; E=EUR; F=CHF; G=GBP; J=JPY; N=NZD; U=USD; H=HKD; S=SGD; Z=ZAR. So you could type GJ or gj instead of GBPJPY, for example. If the pair name typed is not exactly 2 characters, the abbreviation will not be recognized
- ShowPointCount – if set to TRUE, displays a counter above the plot, showing the number of candles from the BasePoint. If set to FALSE, the date/time of each data point will be displayed instead
- LegendValues – if non-blank, this will display the numeric values of all plots at the specified data point, in all timeframes (0 is the most recent point, 1 the second most recent, and so on leftwards; -1 means the leftmost point). To have the list ranked from the lowest to highest value, or highest to lowest, include an (upper or lowercase) A or D, for an ascending or descending sort by value
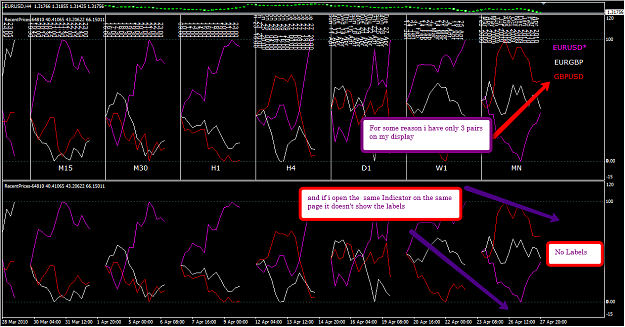
- LegendVertSpacing – a lower number means that the items will be squashed closer together vertically; a higher number widens the spacing between them. You can also include any of (upper or lowercase) T, B, L, or R, to have the legend display at the top, bottom, left or right of each timeframe window. Items are color-coded to match their respective plots. The TextFont and TextSize parameters determine the font that will be used
- Text Color/Font/Size – should be self-explanatory. Font name must be spelled correctly for Windows to recognize it. Color must be spelled correctly, but may contain embedded spaces, and upper/lower case may be used interchangeably. Colors in the parameter file may alternatively be entered in R###G###B### format, e.g. b255r255 will produce magenta
- RefreshEveryXMins – if set to 0, this will cause the window to update itself immediately a new tick occurs. If set to 1, 5, 15, 30, 60, or 240, this will cause the window to update itself immediately a new candle appears on the 'parent' pair's chart (the chart to which the indicator is attached). Setting a non-zero value can improve computer performance
- OutputFile – if left blank, no output occurs. Otherwise, typing in the name of the file here will cause CSV output of all values plotted to be exported to the file name that you specify, in folder ...../experts/files, every time the indicator refreshes. The content of this file could then be imported by an EA, or by an application like Excel, for use in further analysis
- PairN – the pair you want plotted in buffer# N. MT4 allows a max of 8 buffers. To disable a pair from being plotted, set this entry to blank. Upper/lowercase may be used interchangeably (e.g. USDCHF or usdchf). Permissible abbreviations are: A=AUD; C=CAD; E=EUR; F=CHF; G=GBP; J=JPY; N=NZD; U=USD; H=HKD; S=SGD; Z=ZAR. So you could type GJ or gj instead of GBPJPY, for example. If the pair name typed is not exactly 2 characters, the abbreviation will not be recognized. Reducing the pairs plotted to only those that you're interested in, makes the tangled mess more easily viewable

- Pn_Color, Pn_Style – the color and style for each plot. Color must be spelled correctly, but may contain embedded spaces, and upper/lower case may be used interchangeably. Colors in the parameter file may alternatively be entered in R###G###B### format, e.g. b255r255 will produce magenta. Valid values for style are: 10 = solid line of width 1; 11 = dashed line; 12 = dotted line; 13 = dash-dot; 14 = dash-dot-dot; 20, 30, 40, 50 = solid line of width 2, 3, 4, 5 respectively. Enter a leading minus sign, to invert a plot. e.g. Supposing you want to show all USD based pairs, where a gain in strength for USD results in a rising plot. Enter positive Style values for USDxxx currencies, and negative values for all xxxUSD currencies
CHANGE HISTORY
v 1.00: Initial release
v 1.01: Added CurrencyFile and ShowPointCount parameters (see post #3 for screenshot). Fixed a couple of minor bugs.
v 1.02: Added SetBaseCurrency and HistoricalShift parameters. Can now have a different NumPoints, BasePoint, and HistoricalShift value for each timeframe. TimeFrames now display left-to-right in the order that you type them. Abbreviated currency/pair symbols (e.g. EU, GJ) can now be entered. Indicator ShortName has been abbreviated.
v 1.03: Date/time now displayed above each data point if ShowPointCount = FALSE
v 1.04: Added OuputFile option (see above for details)
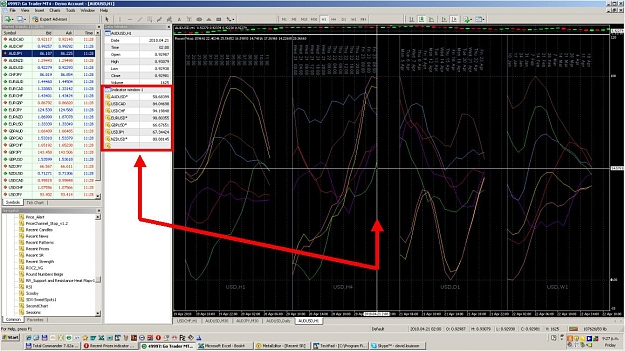
v 1.05: Now displays currency names in Data Window. See notes/screenshot in post #13.
v 1.06:
1. In the parameter file, colors may now alternatively be entered in the form (e.g.) r255b0g127 i.e. specifying a red, blue and green value (0-255) for each primary color in the desired mix.
2. New parameters LegendValues and LegendVertSpacing now optionally allow a color-coded display of all plot values at any specified point, and their relevant currency, on each timeframe.
3. Instead of a rolling window of NumPoints candles, a fixed starting point may optionally be specified, for each timeframe. This means that the window will grow horizontally as more time points are progressively added. The starting point may be specified as either YYYY.MM.DD HH:MM, or as a timeframe identifier (M5, M15, etc), which means that the window will reset itself at the start of each such timeframe.
4. Increased max NumPoints+SmoothingSMA value from 500 to 2,000.
___________________________
MT4 Indicators/EAs by Hanover:
Recent Strength — display line-based plot of weighted average of currency (as opposed to pair) strength
Recent Prices — display line-based plots of any combo of pairs/timeframes on your current chart, to compare their relative strength
Recent Candles — display candles of any combo of pairs/timeframes on your current chart
Recent SR — auto-plot horizontal support/resistance lines based on a wide variety of settings
Recent News — display upcoming and/or historical news announcements from FF calendar; countdown/alert upcoming announcements
Daily Lines/Boxes — auto-plot horizontal or vertical lines, boxes, symbols on user-defined times, days of the week, etc
Display Info all pairs — display spread, daily range, dollars/pip, swap rates etc for all pairs
Spaced Lines — auto-plot horizontal lines on your charts
Stealth Master EA — hide your SL and TP from unscrupulous br0kers!
Do-it-yourself alerts builder kit — code template that you can copy/paste that will add pop-up and/or e-mail alerts to most 'standard' indicators