i downloaded this indicator and loaded but this is what i am getting. please i need help i dont know what i ve done wrong. i am running
on windows xp
Thanks
i downloaded this indicator and loaded but this is what i am getting. please i need help i dont know what i ve done wrong. i am running
on windows xp
Thanks
Austine
Ignored
Austine,
It's good that you're running XP, that eliminates a lot of potential problems to begin with.
Remove the Recent Strength indy from your chart. Then run the Build Strength Preset File script (attached to post #1 of this thread). Simply accept the default parameters. It should take less than 1 second to run. This will build the parameter file correctly.
Then attach the Recent Strength indy to an empty chart. Simply accept the default parameters.
Drag the separator between the main price chart and the indicator sub-window upward, to give the indicator as much vertical space as possible. The price chart is unimportant; you need to dedicate one chart for this indicator.
Then press the + key a couple of times, to zoom out. There are 6 levels of zoom, obtainable by pressing the + and - keys. I find the second largest zoom to be the best one for this indicator.
The chart sub-window should start to fill up with lines, over a period of 10-20 minutes. (The number that I've highlighted in the screenshot should increase steadily as all of the required data is being gathered from your br0ker). However, this time depends on your br0ker. If the whole process is taking hours rather than minutes, then please see this post. It contains a link that explains how to load the data from your br0ker manually.
The full plot should look something like the attached screenshot.
If, after trying the above, you are still having problems: who is your br0ker, and what MT4 build are you running? (You can find the build by using menu option Help....About....) I will download their platform and attempt to reproduce the problem.
i have followed your instruction but my charts is not updating
i am using mt4 built 406 however my platform is downloadable at wealthtradefx.com
thank you.
Ignored
Austine,
I have visited wealthtradefx.com, but they will not allow me to open a demo account, unless I supply personal financial details. I can understand that they would require this info for a live account, but not for demo. As I am unwilling to supply this information, I'm sorry, but I can not download their MT4.
The strength indicator runs on at least four MT4 br0ker platforms that I know of. I am running it on GoMarkets build 402, because build 406 appears to have speed problems. Perhaps you could consider running the strength indy on another br0ker platform (If you can find one that offers all 28 pairs, then that will give the most comprehensive strength values). You could do this but still trade with wealthtradefx.com, if you wish.
I have visited wealthtradefx.com, but they will not allow me to open a demo account, unless I supply personal financial details. I can understand that they would require this info for a live account, but not for demo. As I am unwilling to supply this information, I'm sorry, but I can not download their MT4.
The strength indicator runs on at least four MT4 br0ker platforms that I know of. I am running it on GoMarkets build 402, because build 406 appears...
I had a question about the smoothing factor. Would a factor of 1 (no smoothing) give a more pure or accurate view of the recent strength lines and their relationship to each other?
Thanks so much for your incredible indicator. Combined with the work Steve is doing on the EA I'm really excited about the possibilities here.
Thanks again.
Ignored
Nubchai,
The SmoothingSMA simply applies a simple moving average, or SMA, to each one of the plots. This works exactly the same as applying a SMA to a 'normal' chart of closing prices. As we all know, a SMA of 1 simply reflects the latest closing value. Increasing the SMA value to 2,3,4, etc has the effect of smoothing the lines, but at the cost of introducing lag. For example, a 10 period SMA lags the price more than a 5 period SMA.
If you're using the RS indy to view price plots, the smoothing eliminates some of the jagged zigzagging, and makes the plots clearer to view. I set SmoothingSMA to 4, but there is no real magic in that number; it is merely a personal preference.
If you're using the RS indy as the basis for providing data for an EA (like Steve's Hanover EA), then clarity of viewing is not an issue. Hence it would seem sensible to reduce lag altogether, and set SmoothingSMA to 1. Having said that, I have no idea what SmoothingSMA value would generate maximum trading profit. My gut feeling is that, given all of the other variables involved, it wouldn't make much difference.
One word of caution: don't set the SmoothingSMA to a value less than 1. It could cause unpredictable results, e.g. a division by zero error that causes MT4 to freeze up.
The SmoothingSMA simply applies a simple moving average, or SMA, to each one of the plots. This works exactly the same as applying a SMA to a 'normal' chart of closing prices. As we all know, a SMA of 1 simply reflects the latest closing value. Increasing the SMA value to 2,3,4, etc has the effect of smoothing the lines, but at the cost of introducing lag. For example, a 10 period SMA lags the price more than a 5 period SMA.
If you're using the RS indy to view price plots, the smoothing eliminates some of the jagged zigzagging,...
Comparing each currency against another, nice and neat.
Let me know if you could do it for the community of FF.
Thanks.
Ignored
If you want to compare pairs instead of currencies, please feel welcome to view my Recent Prices and Recent Candles indicators.
Personally, I think lines (which reflect change as a continuous stream of values) are preferable to simply displaying a discrete value. However, the Recent Strength and Recent Prices indicators can be made to do both.
If you want an indicator like the one in your screenshot programmed, you would need to explain exactly how the values are calculated (i.e. what data is being measured or averaged, and over what time period). In any case, I am too busy to take on any other major projects at this time.
[EDIT]
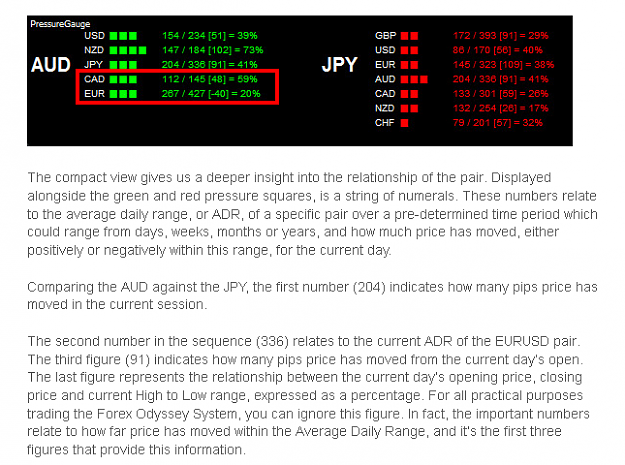
Out of curiosity, I checked out the link in your post. The screenshot below is taken from that link. I can't make sense as to how the number of blocks is calculated. For example, both AUD:CAD and AUD:EUR have three green blocks showing. But according to the values posted, AUDCAD has risen 48 pips since the daily open, and AUDEUR has fallen 40 pips. And AUDCAD has a value of 59% (do you know how this value is calculated?) and AUDEUR has a value of 20%. Hence neither of these values seem to have any bearing on the number of green blocks.
In my view, the idea of merely displaying values based on today's pip moves versus ADRs is limited. It tells nothing of performance from the previous days, let alone weeks. The indicators that I provided are capable of plotting values going back any number of points, on all of 9 different MT4 timeframes. If you want an indicator that's capable of showing the same values (today's range; ADR; move from today's open) across all pairs, here is one that I wrote some time ago. There's also a strength meter that I wrote, based on this data, earlier in this thread (here).
In any case, it's not the information that's presented that is key as to whether it can be used profitably, but the extent to which the underlying concept is sound.
Finally, have a look at the videos of the FX Multimap, FX Power Index, and Intellitrend currency meter here. These are very well presented, IMO, but unfortunately, the products being sold by TopGun are not MT4 compatible.
Because your current indicator is base on lines to reflect the strength of a currency,it changes moves up and down as it refreshes which makes it difficult for viewing and decision making.
One suggestion is that you could improve the current indicator and make it a visual style like the one posted. Perhaps you could do a poll and see what the majority thinks. I'm willing to pay for it as I think its really easy to view a currency against others in a much table form way. Secondly, we can save up alot of space for other uses. Also that if you were to implement this, we need not use a sub window.
I have attach a blank.tpl for a total empty background with no chartings, one could attach your current relative strength,you have to mod yours not to show sub window or if you have plans to make one I suggest, let me know.
[EDIT]Out of curiosity, I checked out the link in your post. The screenshot below is taken from that link. I can't make sense as to how the number of blocks is calculated. For example, both AUD:CAD and AUD:EUR have three green blocks showing. But according to the values posted, AUDCAD has risen 48 pips since the daily open, and AUDEUR has fallen 40 pips. And AUDCAD has a value of 59% (do you know how this value is calculated?) and AUDEUR has a value of 20%. Hence neither of these values seem to have any bearing on the number of green blocks....
Ignored
I believe that the blocks are showing the strength of that pair against the rest of the pairs, using whatever you coders use to make that calculation, and the other values are exactly what they say they are, that is ADR
The theory being, IMHO, a pair may be really strong, say 5 blocks representing 100%, but if it has moved 100% or more of the ADR, you may reconsider entering a trade at that point (depending on the type of signal of course, trend or counter-trend)
So basically, the blocks and the values are not connected, they are 2 completely different calculation?
|
Joined Oct 2011
|
Status: Junior Member
|2 Posts
This post relates mostly to SteveHopwood's Hanover thread but since I am a new member with no vouchers I can not post there. Hopefully somebody will find the following useful.
Instead of using a program like "WatchAndCopy" to track changes in the Output---Recent Strength.csv and copying the file to a different Metatrader installation than the one running the recent Strength indicator, one can use a symbolic link and reference the file directly. For those unfamiliar with symbolic links (it's a Unix feature, recently ported to Windows) they are different than shortcuts in the manner that they can be acted upon by a user or an application in exactly the same manner as the original file.
In Windows Vista and 7 you can use the command (run cmd as administrator) mklink.
For more information check: http://www.howtogeek.com/howto/16226...dows-or-linux/
Again, I apologize if this post is found to be unrelated to this thread.
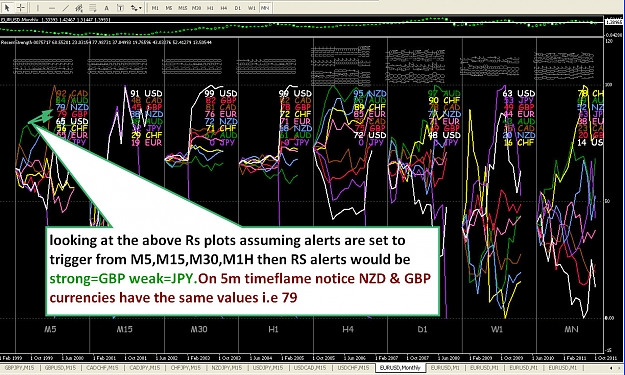
I have upgraded RSalerts. The way in which it looks for changes in the strength/weakness rankings since the alerts were last generated, is now somewhat more robust.
Download from post #1. Instructions in post #323.
Ignored
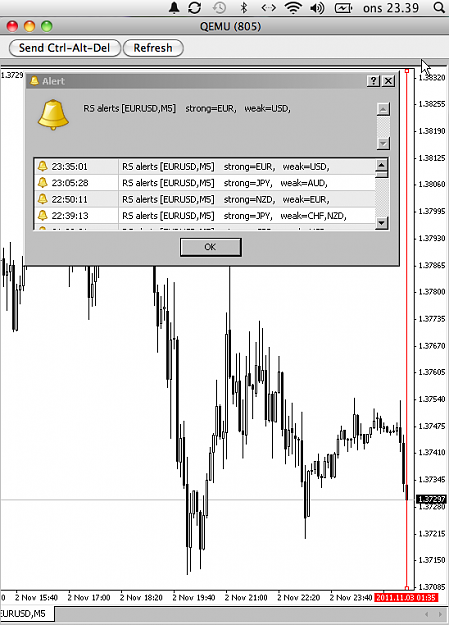
I have noted RSalerts is now alerting if currencies having same values exist . See attached screenshot.
Attached Image (click to enlarge)
Don't tell me the sky is the limit when there are footprints on the moon.
Absolutely no need to apologize. Many thanks for the info.
I've created a link in Steve's thread to your post.
Welcome to the forum.
David
Ignored
Thanks David for the welcome.
As for Windows XP, it is possible to create symbolic links (hardlinks actually) with the command "fsutil hardlink create" as long as they are in the same NTFS volume. One restriction XP have, is the inability to create links in network shares. Not sure how many people will need that, but I do so I'll probably stick to Windows 7 installations.
Anyway, the link I posted earlier explains everything in perfect detail.
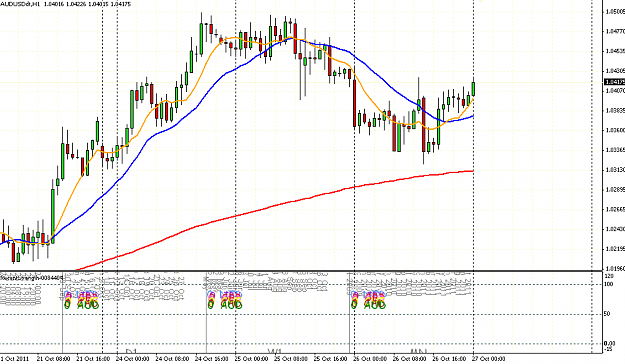
I hope that I'm not missing something totally logical, but I have a time issue with the RS Alert indicator.
I thought the Alert indi would report in broker/MT4 time, or am I wrong?
As You can see on the attached screenshot the alert came on just a few minutes ago. The Broker-time/MT4 time is 0135 at the vertical red line when the alert came on (I'm using Axis Trader which have NY-close candles).
However the pop-up window says 2335 for the alert time - a 2 hour difference - which is the same as my local timezone.
It's just a minor issue though. Since the time information is only needed for visual backtesting.
Another thing though:
I think your own suggestion earlier about a slope confirmation as alert filter would be quite valuable to the indicator. Especially for traders using smaller timeframes and thereby in need for the best filtering of trade suggestions to minimize the information flow.
If You're planning another release of the alert indicator You might consider a UseSlopeConfirmation true/false parameter as a final filter for the strength/weakness-alert.
I imagine something like: Strength-value shift1 > strength-value shift0 for a strong currency (in the process of weakening) and opposite for a weak currency now strengthening. Or what did You have in mind?
Hi David ......
I thought the Alert indi would report in broker/MT4 time, or am I wrong?
.......
Another thing though:
I think your own suggestion earlier about a slope confirmation as alert filter would be quite valuable to the indicator. Especially for traders using smaller timeframes and thereby in need for the best filtering of trade suggestions to minimize the information flow.
If You're planning another release of the alert indicator You might consider a UseSlopeConfirmation true/false parameter as a final filter for the strength/weakness-alert....
Ignored
Hi Tomas,
For reasons best known to them, MetaQuotes (the developers of MT4) chose to timestamp alerts using local time instead of MT4 time. However, the MQL4 language does give the indy/EA programmer full control over what is placed in the alert description. Hence I could easily add the MT4 time at the start of the description. [EDIT] I have done this. You can download the latest version of the indy from post #1.
The RS alerts indy was written with Benji's (kibed83) requirements in mind. He prefers to use the static values in the legend, rather than the slope. However, I will think about how to best add a slope option, so that it can work both ways. I am working full time during weekdays, so I probably won't get a chance to look at it until next weekend.