• Home
  • Forums
  • Trades
  • News
  • Calendar
  • Market
  • Brokers
  • Login
  • Join
  • User/Email: Password:
  • 7:30pm
Menu
  • Forums
  • Trades
  • News
  • Calendar
  • Market
  • Brokers
  • Login
  • Join
  • 7:30pm
Sister Sites
  • Metals Mine
  • Energy EXCH
  • Crypto Craft

Options

Bookmark Thread

First Page First Unread Last Page Last Post

Print Thread

Similar Threads

Why is GBPUSD called cable? 67 replies

Cable Update (GBP/USD) without Idiots 21 replies

Cable (GBPUSD) vs Euro (EURUSD) 26 replies

Is it just me or is cable acting random? 15 replies

cable short for gbpusd? 6 replies

  • Interactive Trading
  • /
  • Reply to Thread
  • Subscribe
  • 150,617
Attachments: Cable Update (GBPUSD)
Exit Attachments

Cable Update (GBPUSD)

  • Last Post
  •  
  • 1 3245932460Page 324613246232463 33006
  • 1 Page 32461 33006
  •  
  • Post #649,201
  • Quote
  • Jan 23, 2022 11:02am Jan 23, 2022 11:02am
  •  UKBanter
  • | Joined Mar 2017 | Status: Member | 908 Posts
Quoting OnlineAddict
Disliked
{quote} Stocks will definitely crash...and then they will be heavily bought and go into new highs again, like always.
Ignored
Are you suggesting the rate rises and tapering will be abandond after a mini crash then buisness as usual?
DISCLAIMER: If indeed they actually do either of those things.
Every day is a schoolday.
 
 
  • Post #649,202
  • Quote
  • Jan 23, 2022 11:12am Jan 23, 2022 11:12am
  •  OnlineAddict
  • Joined May 2014 | Status: Veteran | 8,480 Posts | Invisible
Quoting UKBanter
Disliked
{quote} Are you suggesting the rate rises and tapering will be abandond after a mini crash then buisness as usual? DISCLAIMER: If indeed they actually do either of those things.
Ignored
I don't even think they will raise rates 3 or more times this year, as they claim. But whatever happens, stock market is going up for how long, 100 years? Every dip was bought and made a new high...we don't need to reinvent the wheel here.
Everyone can see the chart, but only a few can actually read it.
 
2
  • Post #649,203
  • Quote
  • Jan 23, 2022 11:28am Jan 23, 2022 11:28am
  •  Ihlas
  • Joined Nov 2020 | Status: Member | 1,897 Posts
Quoting OnlineAddict
Disliked
{quote} I think the bigger picture is 1.5, not below 1.20.
Ignored
Even bigger picture than previous, you're also right, imho first down(As EU/EG long-term bullish, 1.5 also might be the first)
For me EU 1.19+, if GU can climb with EU, we're already there
Maybe it will take 2-3 years
Attached Image (click to enlarge)
Click to Enlarge

Name: GBPUSDWeekly.png
Size: 37 KB
 
1
  • Post #649,204
  • Quote
  • Jan 23, 2022 11:50am Jan 23, 2022 11:50am
  •  Wavegarrick
  • Joined Sep 2017 | Status: Member | 2,422 Posts
Quoting Wavegarrick
Disliked
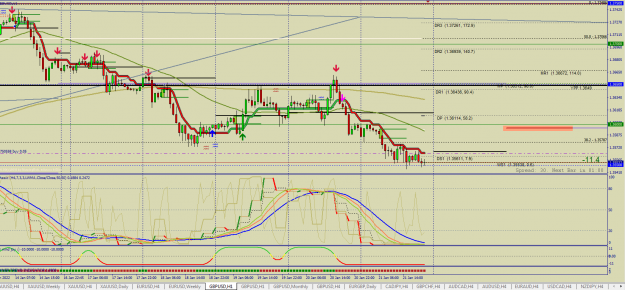
{quote} Yes, Sir, it was 35 pips. In fact, I closed it for 30 pips on the break of 1.36000 but also offset it against a buy trade taken earlier in January. I am completely flat now and await clearer direction. As I said, January is not an easy month for me. Have a great day, Cheers. {image}
Ignored
Anyway Folks,
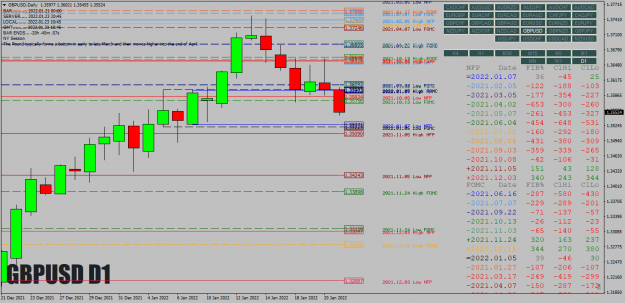
For now, I see at least a test of my future weekly pivot at 1.35957 ish (highlighted area)for a 42 pipper and possibly an overshoot to 1.36000. Mid-round numbers when tested for the first time like to retrace back to round numbers. I also have my weekly support 1 here. Much will be decided around 1.3600 in the coming week. We are also going into month-end and volatile moves with profit-taking and so forth.
Trade safe,
Cheers.
Attached Image (click to enlarge)
Click to Enlarge

Name: Screenshot_1481.png
Size: 89 KB
Trade to Trade another day.
 
7
  • Post #649,205
  • Quote
  • Edited at 2:11pm Jan 23, 2022 12:33pm | Edited at 2:11pm
  •  pipibrasci
  • Joined May 2021 | Status: Member | 521 Posts
Quoting pipibrasci
Disliked
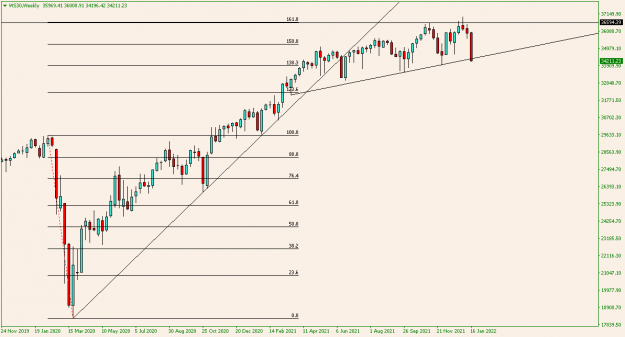
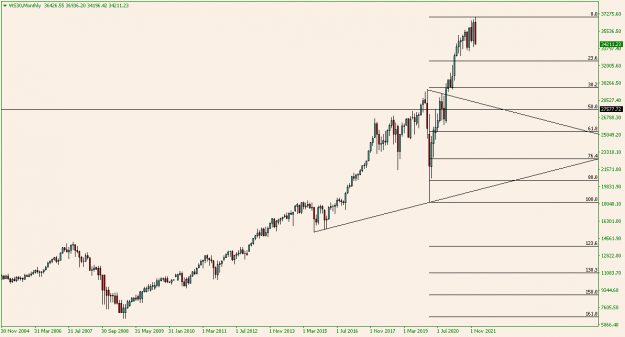
Now I have this...going into next week. Something interesting. Weekly chart vs Daily chart. Consistent reversal candlestick patterns on the upper trendline (weekly chart). Strong Fib levels. 0.382 as support and 0.236. as resistance (although broken but price retraced). Price bouncing off them. Likely to retrace back to the 0.382 fib level?? Currently hovering around a support zone 1.35580 - 1.35250 Momentum and volatility no doubt is high as channel expands. Next level of support (Targets) i see are 1.3460 - 1.3408 Head & Shoulder pattern (weekly)...
Ignored
POSSIBLE TARGETS IN THE WEEK

LONGS/PullBack/retracement levels (1.3575; 1.3609)

SHORTS (1.3525; 1.3500; 1.3460; 1.3408)

Grit; Knowledge; positive mindset; all you need to overcome & KIS!!!
 
1
  • Post #649,206
  • Quote
  • Jan 23, 2022 1:25pm Jan 23, 2022 1:25pm
  •  nAVIN2007
  • Joined Dec 2007 | Status: mac daddy junior :) | 21,203 Posts
Quoting Bones
Disliked
{quote} hi Nav ,they banned it in the uk for retail
Ignored

why did they ban it..I have friend who just believes it will go up?
whats your thoughts on it..
 
 
  • Post #649,207
  • Quote
  • Jan 23, 2022 1:45pm Jan 23, 2022 1:45pm
  •  TooSlow
  • Joined Mar 2012 | Status: Trader | 11,556 Posts
Quoting Georginson
Disliked
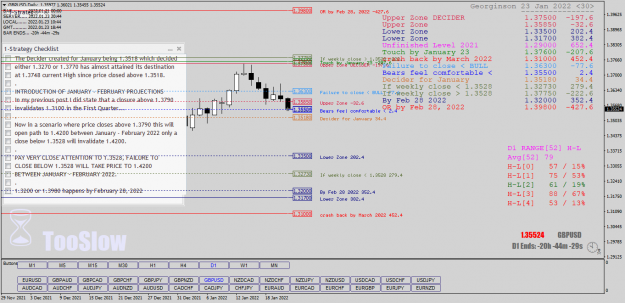
If there any certainty I see ahead, it's either 1.3200 or 1.3980 happens within 5 weeks (January 25th to February 28). Which do we get 1.3200 OR 1.3980 by or before February 28, 2022?
Ignored
Attached Image (click to enlarge)
Click to Enlarge

Name: TOOSLOW4.png
Size: 85 KB
My Threads: Trading is as simple as 1-2-3, Highest Open / Lowest Open Trade
 
2
  • Post #649,208
  • Quote
  • Jan 23, 2022 1:46pm Jan 23, 2022 1:46pm
  •  TooSlow
  • Joined Mar 2012 | Status: Trader | 11,556 Posts
Attached Image (click to enlarge)
Click to Enlarge

Name: TOOSLOW2.png
Size: 75 KB
My Threads: Trading is as simple as 1-2-3, Highest Open / Lowest Open Trade
 
 
  • Post #649,209
  • Quote
  • Jan 23, 2022 1:49pm Jan 23, 2022 1:49pm
  •  TooSlow
  • Joined Mar 2012 | Status: Trader | 11,556 Posts
Attached Image (click to enlarge)
Click to Enlarge

Name: TOOSLOW1.png
Size: 53 KB

H4 Supply Demand Zones.
My Threads: Trading is as simple as 1-2-3, Highest Open / Lowest Open Trade
 
 
  • Post #649,210
  • Quote
  • Jan 23, 2022 2:32pm Jan 23, 2022 2:32pm
  •  trumps
  • Joined Mar 2020 | Status: Member | 2,257 Posts
Quoting Bones
Disliked
{quote} it is logical but not reliable ,2020 bitcoin had an halving 2020 $ tanked,2021 bitcoin rallied bitcoin is fatally flawed because of stable coins like tether if stocks fall those stable coins will likely go bust ,then bitcoin could go up after from a much lower level Its a bit like comparing fed chat with $ when the environment is completely different ,we have inflation not seen for 39 years whatever the fed do it won't be enough to curb it and its highly likely something will blow up before they get there thats not a guess because they carry...
Ignored
Yep I get you.
Good Vibes - In charts we trust
Pulchra All Time Return: -88.4%
 
1
  • Post #649,211
  • Quote
  • Jan 23, 2022 2:50pm Jan 23, 2022 2:50pm
  •  Jolita
  • Joined Jan 2012 | Status: Online | 1,992 Posts
Quoting Kwt4x
Disliked
retail traders: don't have to file a report for COT, small shares = dump money non-commercial: have to file daily report for COT, have no direct business interests in the commodity(profit motive), large positions = smart money commercial: have to file daily report for COT, direct business interests in the commodity, hedge for protection(defensive motive) = nothing smart about that cheers,
Ignored

  1. Commercial traders (Hedgers)
  2. Non-commercial traders (Large Speculators)
  3. Retail traders (Small Speculators)

Basically follow the Large Trader or also known as Non Commercial Trader.
Commercial Traders safeguard the opposite side, when chart gap is furthest away between them, trade is called extreme and reversal is happening.
You will be making good pips by only following the large trader.

I find this info very useful, follow the pages
https://www.babypips.com/learn/forex...ading-strategy

Staying positive
 
2
  • Post #649,212
  • Quote
  • Jan 23, 2022 2:55pm Jan 23, 2022 2:55pm
  •  trumps
  • Joined Mar 2020 | Status: Member | 2,257 Posts
Stocks have def. maxed out at the ext point.
If we get to the 50 fib retrace, buy the dip Fed signals could well start to appear
Attached Images (click to enlarge)
Click to Enlarge

Name: WS30Weekly.png
Size: 14 KB Click to Enlarge

Name: WS30Monthly1.png
Size: 13 KB
Good Vibes - In charts we trust
Pulchra All Time Return: -88.4%
 
 
  • Post #649,213
  • Quote
  • Jan 23, 2022 2:57pm Jan 23, 2022 2:57pm
  •  trumps
  • Joined Mar 2020 | Status: Member | 2,257 Posts
Quoting Jolita
Disliked
{quote} Commercial traders (Hedgers) Non-commercial traders (Large Speculators) Retail traders (Small Speculators) Basically follow the Large Trader or also known as Non Commercial Trader. Commercial Traders safeguard the opposite side, when chart gap is furthest away between them, trade is called extreme and reversal is happening. You will be making good pips by only following the large trader. I find this info very useful, follow the pages https://www.babypips.com/learn/forex...ading-strategy
Ignored
I don't get it.
The comparison charts provided by Kuroro, show non-commercials load up heavy shorts at the bottom and heavy longs at the top.
I don't think we should do the same.
Good Vibes - In charts we trust
Pulchra All Time Return: -88.4%
 
 
  • Post #649,214
  • Quote
  • Edited at 3:34pm Jan 23, 2022 3:18pm | Edited at 3:34pm
  •  W0lfram
  • Joined Dec 2020 | Status: Crossed over into the Twilight Zone | 1,157 Posts
Quoting kuroro001
Disliked
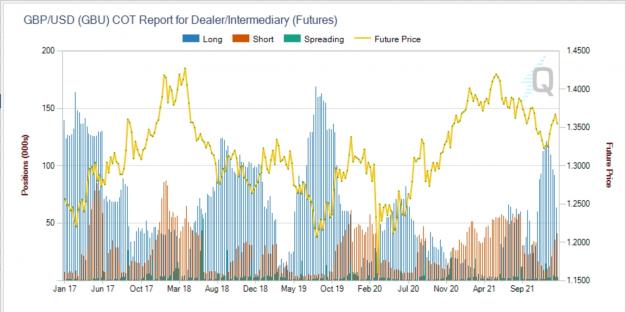
{quote} Nope sir, its the opposite, for sure Check charts below, and tell me about it On the left yellow commercials aka smart money On the right green non commercials aka dumb money Lets look at the non commercial (green chart). So for you, the smart money is going long on top, and short on bottom ? They aren't that smart But we agree that both smart and dumb money can be right and wrong {image}
Ignored
Looking at the dynamics of two curves: price and long positions - dealers add to longs in a downtrend and vice versa
so the correlation is negative
Attached Image (click to enlarge)
Click to Enlarge

Name: Screenshot_20220123-220637.jpg
Size: 421 KB
While it's positive for positions of non-commercials from Legacy report
https://www.forexfactory.com/thread/...2#post13419322
 
2
  • Post #649,215
  • Quote
  • Jan 23, 2022 3:25pm Jan 23, 2022 3:25pm
  •  genadi
  • Joined Nov 2020 | Status: Member | 1,607 Posts
Attached Image (click to enlarge)
Click to Enlarge

Name: cot gu.jpg
Size: 84 KB
 
2
  • Post #649,216
  • Quote
  • Jan 23, 2022 3:28pm Jan 23, 2022 3:28pm
  •  Jolita
  • Joined Jan 2012 | Status: Online | 1,992 Posts
Quoting trumps
Disliked
{quote} I don't get it. The comparison charts provided by Kuroro, show non-commercials load up heavy shorts at the bottom and heavy longs at the top. I don't think we should do the same.
Ignored
Kuroro report wasnt filtered to show all traders at once.

I was refering to COT report template example on Babypips.
Staying positive
 
 
  • Post #649,217
  • Quote
  • Jan 23, 2022 3:35pm Jan 23, 2022 3:35pm
  •  Jolita
  • Joined Jan 2012 | Status: Online | 1,992 Posts
Does anyone have COT Graph indicator to share please?
Staying positive
 
1
  • Post #649,218
  • Quote
  • Jan 23, 2022 3:47pm Jan 23, 2022 3:47pm
  •  Kwt4x
  • Joined Apr 2015 | Status: Member | 232 Posts
Quoting Jolita
Disliked
{quote} Commercial traders (Hedgers) Non-commercial traders (Large Speculators) Retail traders (Small Speculators) Basically follow the Large Trader or also known as Non Commercial Trader. Commercial Traders safeguard the opposite side, when chart gap is furthest away between them, trade is called extreme and reversal is happening. You will be making good pips by only following the large trader. I find this info very useful, follow the pages https://www.babypips.com/learn/forex...ading-strategy
Ignored
thanks Jolita,

I've done COT reports years ago but found out it's more like long term swing trading, so I left it for math and time-trading since I can get direction for daytrading.

cheers,
 
1
  • Post #649,219
  • Quote
  • Edited at 4:14pm Jan 23, 2022 4:03pm | Edited at 4:14pm
  •  W0lfram
  • Joined Dec 2020 | Status: Crossed over into the Twilight Zone | 1,157 Posts
Quoting Jolita
Disliked
Does anyone have COT Graph indicator to share please?
Ignored
https://www.tradingview.com/script/1...egacy-Metrics/
Choose 'Auto' in COT Selection Mode for automatic data retrieval for current ticker. Other settings are up to you
Attached Image (click to enlarge)
Click to Enlarge

Name: Screenshot_20220123-225851.jpg
Size: 745 KB
Attached Image (click to enlarge)
Click to Enlarge

Name: Screenshot_20220123-230236.jpg
Size: 263 KB
 
4
  • Post #649,220
  • Quote
  • Jan 23, 2022 4:14pm Jan 23, 2022 4:14pm
  •  Jolita
  • Joined Jan 2012 | Status: Online | 1,992 Posts
Quoting W0lfram
Disliked
{quote} https://www.tradingview.com/script/1...egacy-Metrics/ Choose 'Auto' in COT Selection Mode for automatic data retrieval for current ticker. Other settings are up to you{image}{image}
Ignored
Thanks a lot!
Staying positive
 
1
  • Interactive Trading
  • /
  • Cable Update (GBPUSD)
  • Reply to Thread
    • 1 3245932460Page 324613246232463 33006
    • 1 Page 32461 33006
29 traders viewing now, 8 are members:
Yudi109
,
richjobless
,
Invisible
,
Invisible
,
Invisible
,
chess king
,
FromLawang
,
Ehsank78
  • More
Top of Page
Forex Factory Blog Updated: Alerting All Members
  • Facebook
  • Twitter
About FF
  • Mission
  • Products
  • User Guide
  • Media Kit
  • Blog
  • Contact
FF Products
  • Forums
  • Trades
  • Calendar
  • News
  • Market
  • Brokers
  • Trade Explorer
FF Website
  • Homepage
  • Search
  • Members
  • Report a Bug
Follow FF
  • Facebook
  • Twitter

FF Sister Sites:

  • Metals Mine
  • Energy EXCH
  • Crypto Craft

Forex Factory® is a brand of Fair Economy, Inc.

Terms of Service / ©2022