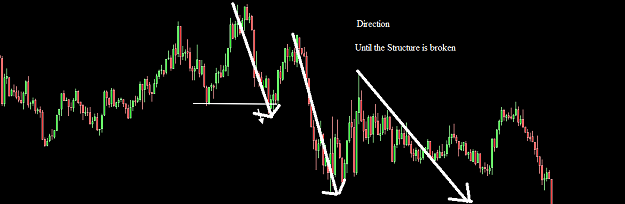
The first question I'm asking myself while watching these charts is, What is the current "direction"? If I can't answer that question, I don't trade.
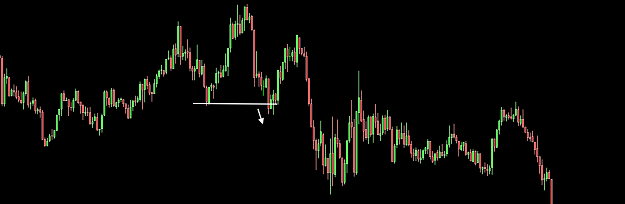
The "teaching" aspect of SR/SD has far too often bamboozled traders by overlooking this question. Instead it often seems to encourage people to just try and spot patterns, which unfortunately for traders is very easy to do. It's a problem because decent looking patterns occur all over the charts but far too often they don't have any context to them, i.e. they're not being considered in the context of market direction, which in itself is a form of technical analysis. Trading a pattern out of context can lead to losses very quickly.
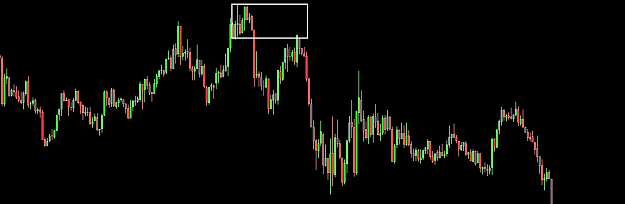
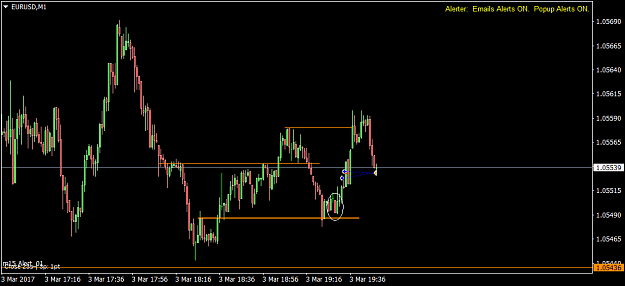
Before anything, my priority is to judge direction. In its simplest form, direction can be read by price breaking areas of support/resistance/supply/demand. If price breaks south of a bullish swing point for example, then I can bias my thinking towards shorts. In that case I'd be looking to sell the tops of any retrace rallies at an opportune location - either on touch or with PA. With that in mind does the chart look any different?
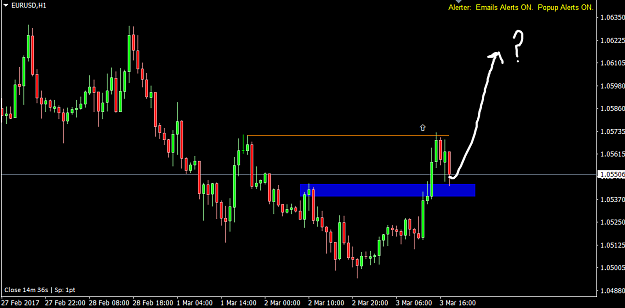
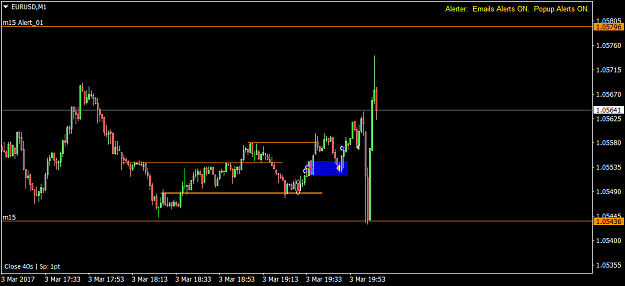
Edit: perhaps the prior chart was confusing. How about drawing it like this...
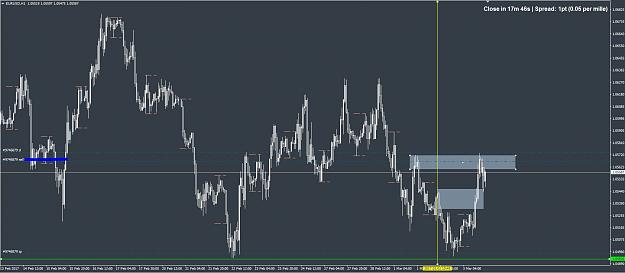
Attached Image (click to enlarge)
3