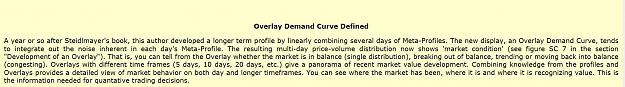
A Three Year Sample of Market Units from Five Day Overlays for emini SP
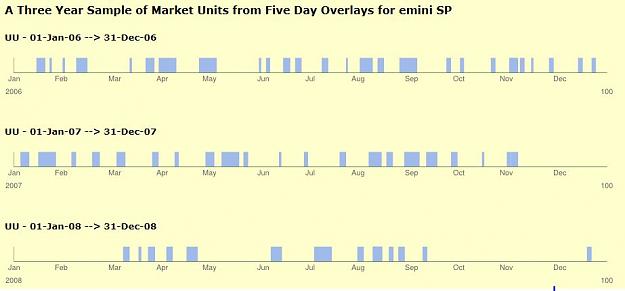
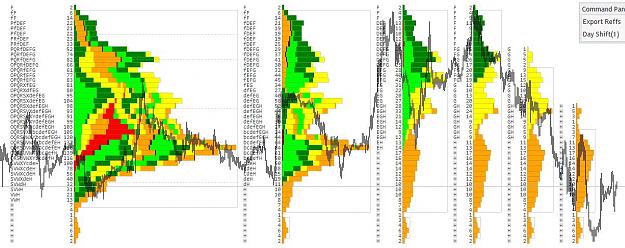
Figure 5. Balance Periods for Three Years of emini SP
This three year period of pauses (the blocks) is additional, convincing, evidence of the lack of periodicity in an auction market's eternal run - pause behavior. Unlike Figure 4 where price levels are included, this graphic is intended to show only the temporal extent of the balances or equilibrium periods.
Some statistics:
Over the three years of Figure 5, there were 59 market units ranging from 3 days (the minimum) to 91 days. The average period is 13 days, four in balance (pause), nine in run. The longest balance is 9 days, the longest run is 87 days. the Shortest pause is 2 days (by definition) and the shortest run is 1 day.
Further, the concept of markets being in equilibrium with steps of non-equilibrium to the next equilibrium level (Portfolio Theory and Capital Markets, W. Sharpe, McGraw Hill, 2000, pg xxiii) is rather tortured if the balance periods, the blocks of equilibria, are present only about a third of the time. Also, the balances vary widely in time (Figure 5) and price (Figure 4). Figure 5 and the balance statistics could lead one to the conclusion that markets can be thought of as non-equilibrium entities with occasional periods of equilibrium. If these findings are applicable to individual stocks, the practice of portfolio management could be in for a big change.
The Market Unit (tm)
By Donald L. Jones, March 17, 2005
Copyright 2005
Attached Image (click to enlarge)
Figure 5. Balance Periods for Three Years of emini SP
This three year period of pauses (the blocks) is additional, convincing, evidence of the lack of periodicity in an auction market's eternal run - pause behavior. Unlike Figure 4 where price levels are included, this graphic is intended to show only the temporal extent of the balances or equilibrium periods.
Some statistics:
Over the three years of Figure 5, there were 59 market units ranging from 3 days (the minimum) to 91 days. The average period is 13 days, four in balance (pause), nine in run. The longest balance is 9 days, the longest run is 87 days. the Shortest pause is 2 days (by definition) and the shortest run is 1 day.
Further, the concept of markets being in equilibrium with steps of non-equilibrium to the next equilibrium level (Portfolio Theory and Capital Markets, W. Sharpe, McGraw Hill, 2000, pg xxiii) is rather tortured if the balance periods, the blocks of equilibria, are present only about a third of the time. Also, the balances vary widely in time (Figure 5) and price (Figure 4). Figure 5 and the balance statistics could lead one to the conclusion that markets can be thought of as non-equilibrium entities with occasional periods of equilibrium. If these findings are applicable to individual stocks, the practice of portfolio management could be in for a big change.
The Market Unit (tm)
By Donald L. Jones, March 17, 2005
Copyright 2005
Markets are not efficient, rather they are effective - Jones