• Home
  • Forums
  • Trades
  • News
  • Calendar
  • Market
  • Brokers
  • Login
  • Join
  • User/Email: Password:
  • 2:25pm
Menu
  • Forums
  • Trades
  • News
  • Calendar
  • Market
  • Brokers
  • Login
  • Join
  • 2:25pm
Sister Sites
  • Metals Mine
  • Energy EXCH
  • Crypto Craft

Options

Bookmark Thread

First Page First Unread Last Page Last Post

Printable Version

Similar Threads

Auction Market Value Theory & Analytics 1556 replies

MarketProfile/Volume Profile/Auction Market Theory indi? 17 replies

Market Profile And Volume Profile MT5 0 replies

market Theory 101 Supply and Demand,Market Cycles 5 replies

Market profile trader-Merged profile 0 replies

  • Trading Discussion
  • /
  • Reply to Thread
  • Subscribe
  • 10,046
Attachments: Auction Market Theory and Market Profile
Exit Attachments

Auction Market Theory and Market Profile

  • Last Post
  •  
  • Page 1 23456 771
  • Page 1 2 771
  •  
  • Post #1
  • Quote
  • First Post: Edited Dec 20, 2012 2:28pm Jan 22, 2011 11:29am | Edited Dec 20, 2012 2:28pm
  •  frankkn
  • Joined Jan 2010 | Status: I'm the greatest, man | 2,514 Posts


AMT resources

James Dalton Videos:
http://vimeo.com/user4051895/videos (A must)

James Dailton daily blog
http://jamesdaltontrading.com/blog/

Alex Benjamin VIDEOS:
http://www.tradingclinic.com/mp201/m...min_021705.wmv

MP101 & MP102 free)

http://www.tradingclinic.com/mp201/m...min_021705.wmv
http://www.tradingclinic.com/downloa...edia/MP102.wmv

MP103
Not free but, clicking on the following link will give you access to a free 3 hour presentation.
http://www.tradingclinic.com/oneoff/...l20080606.html

Father of MP - Peter_Steidlmayer (classics)
http://www.4shared.com/document/WA5J...-_On_Marke.htm
http://www.4shared.com/document/vm01..._Markets_.html

Robin Mersch Strategy
http://www.cmegroup.com/education/in...t-profile.html http://www.forexfactory.com/images/buttons/forward.gif

---------

  1. http://www.4shared.com/office/ivp7jU...r_Markets.html
  2. http://www.4shared.com/office/86LvWx...__Jones_E.html


Wisdom from mzvega:
http://www.forexfactory.com/showthre...49#post6313549

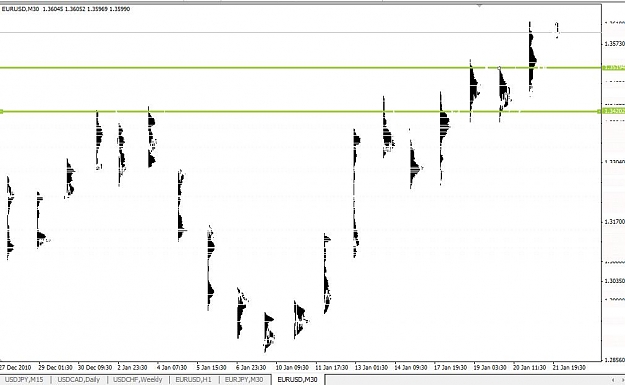
Bandung latest profile indi (non session) :
http://www.forexfactory.com/showthre...52#post5310452

updated Session indi:
http://eyesfx.web44.net/2011/10/mark...icator-update/

Indiconfig tips for GMT & session profiles
http://www.forexfactory.com/showthre...69#post5332069
  • Post #2
  • Quote
  • Jan 22, 2011 11:59am Jan 22, 2011 11:59am
  •  seagreen
  • | Joined Apr 2009 | Status: Junior Bastard | 391 Posts
Quoting frankkn
Disliked
I'm curious, how many of you use Auction Market Theory or Market Profile in your trading?

Here is a recent trade from this past week. This is a 5m EU chart....
Ignored
POC is supposed to show where most trading has occured during the day. As the markets become thin there's not much action and the chart simply prints more "unnecessary" 5min bars in the same range. So what I would suggest is using futures volume data for constructing your POC, at least it would be more accurate.
1
  • Post #3
  • Quote
  • Jan 22, 2011 12:12pm Jan 22, 2011 12:12pm
  •  frankkn
  • Joined Jan 2010 | Status: I'm the greatest, man | 2,514 Posts
Quoting seagreen
Disliked
POC is supposed to show where most trading has occured during the day. As the markets become thin there's not much action and the chart simply prints more "unnecessary" 5min bars in the same range. So what I would suggest is using futures volume data for constructing your POC, at least it would be more accurate.
Ignored
Worked here

Edit: this is the buying climax and subsequent drop in regard to the last chart.
http://cdn.forexfactory.com/attachme...2&d=1295491395
  • Post #4
  • Quote
  • Jan 22, 2011 12:13pm Jan 22, 2011 12:13pm
  •  frankkn
  • Joined Jan 2010 | Status: I'm the greatest, man | 2,514 Posts
Quoting frankkn
Disliked
Worked here
Ignored
And here. Also at demand as well. You can see that earlier price had bounced off of the unfair high (in blue).

http://cdn.forexfactory.com/attachme...5&d=1295568897
  • Post #5
  • Quote
  • Jan 22, 2011 12:19pm Jan 22, 2011 12:19pm
  •  CindyXXXX
  • Joined Feb 2008 | Status: Member | 6,730 Posts
Quoting seagreen
Disliked
POC is supposed to show where most trading has occured during the day. As the markets become thin there's not much action and the chart simply prints more "unnecessary" 5min bars in the same range. So what I would suggest is using futures volume data for constructing your POC, at least it would be more accurate.
Ignored
Either that or simply defining the parameters to the high volume sessions. I've used Futures volumes for the last year for the same info and whilst its a great tool you can literally see these max vol points on a naked price chart just like how Frankkns doing in the above. But for accuracy - CME data couldn't hurt of course.
Time hides Nothing
  • Post #6
  • Quote
  • Jan 23, 2011 12:15pm Jan 23, 2011 12:15pm
  •  frankkn
  • Joined Jan 2010 | Status: I'm the greatest, man | 2,514 Posts
Here is the best info on AMT that I've found so far.

http://www.cisco-futures.com/amt_theory.html
  • Post #7
  • Quote
  • Jan 23, 2011 12:26pm Jan 23, 2011 12:26pm
  •  frankkn
  • Joined Jan 2010 | Status: I'm the greatest, man | 2,514 Posts
Here is another, briefer, read.

http://www.seputarforex.com/ebook/Ma...ile_Basics.pdf
  • Post #8
  • Quote
  • Edited at 9:24pm Jan 23, 2011 9:11pm | Edited at 9:24pm
  •  HiddenGap
  • Joined Aug 2009 | Status: Reading the tape | 2,231 Posts
Quoting frankkn
Disliked
Here is the best info on AMT that I've found so far.

http://www.cisco-futures.com/amt_theory.html
Ignored
Great stuff.

Some others:

1. James Dalton's books and website.
2. CBOT MP manual
3. Institute of Auction Market Theory (IOAMT)
4. BalanceTrader.com

An easy thing to do is google Market Profile videos there is a ton of stuff that comes up. Not all great, not all bad.
The TREND isn't just your friend; it's your lover.
  • Post #9
  • Quote
  • Jan 23, 2011 9:23pm Jan 23, 2011 9:23pm
  •  HiddenGap
  • Joined Aug 2009 | Status: Reading the tape | 2,231 Posts
A good place to start is at the begining.

The market is a dual auction process. It moves from balance to imbalance and back to balance again.
The TREND isn't just your friend; it's your lover.
  • Post #10
  • Quote
  • Jan 23, 2011 9:41pm Jan 23, 2011 9:41pm
  •  frankkn
  • Joined Jan 2010 | Status: I'm the greatest, man | 2,514 Posts
Quoting HiddenGap
Disliked
Great stuff.

Some others:

1. James Dalton's books and website.
2. CBOT MP manual
3. Institute of Auction Market Theory (IOAMT)
4. BalanceTrader.com

An easy thing to do is google Market Profile videos there is a ton of stuff that comes up. Not all great, not all bad.
Ignored
Thank's a million. I'll be devouring these between school/work.

Just watched this
http://www.balancetrader.com/main/bt-outlook/

Awesome, awesome. I can really get down on this shit, thanks HG
  • Post #11
  • Quote
  • Jan 23, 2011 9:55pm Jan 23, 2011 9:55pm
  •  HiddenGap
  • Joined Aug 2009 | Status: Reading the tape | 2,231 Posts
Quoting frankkn
Disliked
Thank's a million. I'll be devouring these between school/work.

Just watched this
http://www.balancetrader.com/main/bt-outlook/

Awesome, awesome. I can really get down on this shit, thanks HG
Ignored
Spent all weekend going thru the videos on balancetrader. Love is work. I have to get Ninja Trader and Fin algo now.
The TREND isn't just your friend; it's your lover.
  • Post #12
  • Quote
  • Jan 23, 2011 10:12pm Jan 23, 2011 10:12pm
  •  frankkn
  • Joined Jan 2010 | Status: I'm the greatest, man | 2,514 Posts
I don't have any way of getting VAH or VAL but here are some eyeballed levels.
Attached Image (click to enlarge)
Click to Enlarge

Name: j23a.jpg
Size: 53 KB
  • Post #13
  • Quote
  • Jan 23, 2011 10:35pm Jan 23, 2011 10:35pm
  •  HiddenGap
  • Joined Aug 2009 | Status: Reading the tape | 2,231 Posts
Here are the levels I am watching.

They are not based on Value Area Highs and Lows or POCs. These are the "clusters" or areas where the market was balanced.
Attached Image (click to enlarge)
Click to Enlarge

Name: Current1.png
Size: 115 KB
The TREND isn't just your friend; it's your lover.
  • Post #14
  • Quote
  • Jan 23, 2011 10:50pm Jan 23, 2011 10:50pm
  •  HiddenGap
  • Joined Aug 2009 | Status: Reading the tape | 2,231 Posts
These were not taken but are based on the Balance Area concept.

The first thing is that we want to trade with trend. We know the trend is up because we broke out of a balance area to the upside and have not traversed back through it.

On my previous post, the blue area is the area in question. The black lines represent friday's balance area so ignore for this post. Because the up auction continues, we would only be looking to get long. I'll leave the VSA for the VSA thread, but you can see some places to enter long in the support area (Balance Area).
Attached Images (click to enlarge)
Click to Enlarge

Name: ex1.png
Size: 120 KB Click to Enlarge

Name: ex2.png
Size: 117 KB
The TREND isn't just your friend; it's your lover.
  • Post #15
  • Quote
  • Jan 24, 2011 6:23pm Jan 24, 2011 6:23pm
  •  frankkn
  • Joined Jan 2010 | Status: I'm the greatest, man | 2,514 Posts
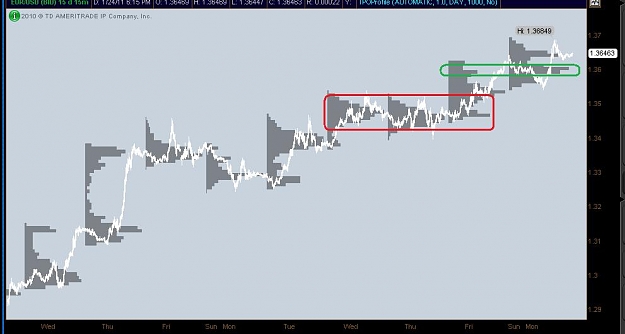
On Mondays I'm too busy to trade because of school/work. Tomorrow I'll be looking for longs in these areas if I can find a good entry.
Attached Image (click to enlarge)
Click to Enlarge

Name: j24a.jpg
Size: 42 KB
  • Post #16
  • Quote
  • Jan 24, 2011 7:01pm Jan 24, 2011 7:01pm
  •  frankkn
  • Joined Jan 2010 | Status: I'm the greatest, man | 2,514 Posts
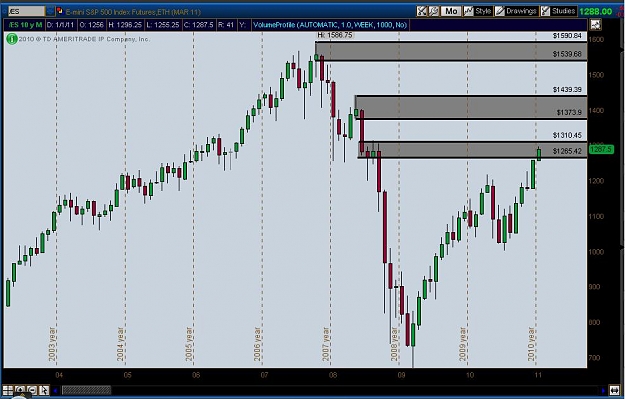
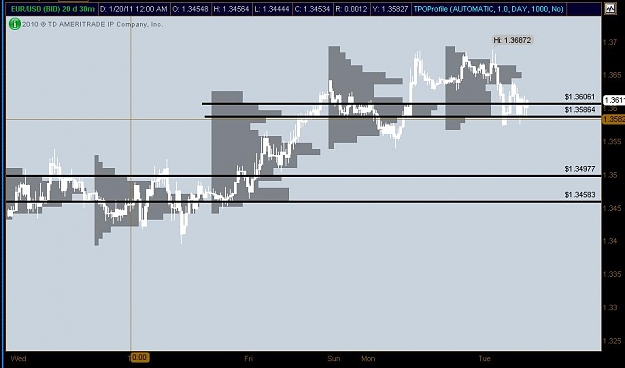
First is a monthly chart of /es showing supply and second is a 30m showing a gap down, but price wasn't able to break this balance area.
Attached Images (click to enlarge)
Click to Enlarge

Name: j24b.jpg
Size: 80 KB Click to Enlarge

Name: j24c.jpg
Size: 73 KB
  • Post #17
  • Quote
  • Jan 25, 2011 6:11am Jan 25, 2011 6:11am
  •  alexm
  • | Joined Jun 2009 | Status: Member | 261 Posts
Subscribed

Keep it coming buddy.
  • Post #18
  • Quote
  • Jan 25, 2011 9:57am Jan 25, 2011 9:57am
  •  frankkn
  • Joined Jan 2010 | Status: I'm the greatest, man | 2,514 Posts
Quoting alexm
Disliked
Subscribed

Keep it coming buddy.
Ignored
The first chart shows (EU) price arriving at my closest balance area. Next is 15m buying then a High volume shake out that was revisited before price moved. The third chart is a 5m showing the bar I entered on. I'm moving my stop to BE at +25 and my TP is at +50 just below 1.3650.
Attached Images (click to enlarge)
Click to Enlarge

Name: j25b.jpg
Size: 49 KB Click to Enlarge

Name: j25c.jpg
Size: 100 KB Click to Enlarge

Name: j25a.jpg
Size: 90 KB
  • Post #19
  • Quote
  • Jan 25, 2011 10:25am Jan 25, 2011 10:25am
  •  frankkn
  • Joined Jan 2010 | Status: I'm the greatest, man | 2,514 Posts
Quoting frankkn
Disliked
The first chart shows (EU) price arriving at my closest balance area. Next is 15m buying then a High volume shake out that was revisited before price moved. The third chart is a 5m showing the bar I entered on. I'm moving my stop to BE at +25 and my TP is at +50 just below 1.3650.
Ignored
Price came back down to one pip above my stop before reversing to my TP.
Attached Image (click to enlarge)
Click to Enlarge

Name: j25d.jpg
Size: 93 KB
  • Post #20
  • Quote
  • Jan 25, 2011 8:21pm Jan 25, 2011 8:21pm
  •  alexm
  • | Joined Jun 2009 | Status: Member | 261 Posts
Have a look at this link. May be we can discuss it further here.

http://www.cmegroup.com/education/fi...11-Edition.pdf
  • Trading Discussion
  • /
  • Auction Market Theory and Market Profile
  • Reply to Thread
    • Page 1 23456 771
    • Page 1 2 771
1 trader viewing now
  • More
Top of Page
  • Facebook
  • Twitter
About FF
  • Mission
  • Products
  • User Guide
  • Media Kit
  • Blog
  • Contact
FF Products
  • Forums
  • Trades
  • Calendar
  • News
  • Market
  • Brokers
  • Trade Explorer
FF Website
  • Homepage
  • Search
  • Members
  • Report a Bug
Follow FF
  • Facebook
  • Twitter

FF Sister Sites:

  • Metals Mine
  • Energy EXCH
  • Crypto Craft

Forex Factory® is a brand of Fair Economy, Inc.

Terms of Service / ©2021