Joined Aug 2009
|
Status: Reading the TAPE
|2,389 Posts
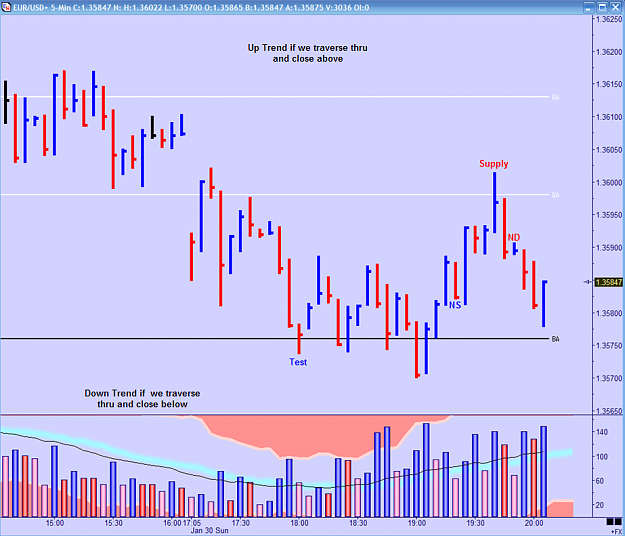
Early price action is ping ponging between two balance areas. If we trade thru the upper balance area, the chart trend is up. If we trade thru the lower balance are, the chart trend is down.
On the daily, even with Friday's down action, we made a higher POC than the previous day. If the POCs are rising, then the trend is up.
Attached Image (click to enlarge)
Without VSA, you're playing checkers while the Smart Money plays chess.
Early price action is ping ponging between two balance areas. If we trade thru the upper balance area, the chart trend is up. If we trade thru the lower balance are, the chart trend is down.
On the daily, even with Friday's down action, we made a higher POC than the previous day. If the POCs are rising, then the trend is up.
Ignored
Hey HG,
Thanks for pointing that out about the POCs I missed that. I'm eager to observe weekly TPOs for major balance areas for long term trend interpretation. I really like the idea you've just mentioned regarding observing POC relationships.
Great chart as always. VSA is the perfect Yang to AMTs Yin.
|
Membership Revoked
|
Joined Sep 2010
|2,072 Posts
have a look in asia,the price went down so fast,that evry upm move was brought down immediately,the voluem said low,but i think its because of low buyers for it,mostly bids
Early price action is ping ponging between two balance areas. If we trade thru the upper balance area, the chart trend is up. If we trade thru the lower balance are, the chart trend is down.
On the daily, even with Friday's down action, we made a higher POC than the previous day. If the POCs are rising, then the trend is up.
Ignored
hmm, curious to see your chart showing the balance area for Friday as higher than thursday, because when i look at the value areas on my H1 chart for EU, i see a balance point of 1.3700 for Friday and BP of 1.3725 for Thursday. Which means the trend is down Plus it started to balance lower at the end of the day on Friday just below what looks like the lower limit of the value area on an H4 chart. Doesn't that imply the trend is now down.
We are in fact ping ponging between last Monday's Asian balance area and LO/NY balance area, and a break out on the 5M up could possibly balance higher, but the trend would only in fact be established once we rebalance outside this current area, no? EU could break up but not rebalance, at which point we would expect price to drop through to the lower area.
hmm, curious to see your chart showing the balance area for Friday as higher than thursday, because when i look at the value areas on my H1 chart for EU, i see a balance point of 1.3700 for Friday and BP of 1.3725 for Thursday. Which means the trend is down Plus it started to balance lower at the end of the day on Friday just below what looks like the lower limit of the value area on an H4 chart. Doesn't that imply the trend is now down.
We are in fact ping ponging between last Monday's Asian balance area and LO/NY balance area, and a break out...
Ignored
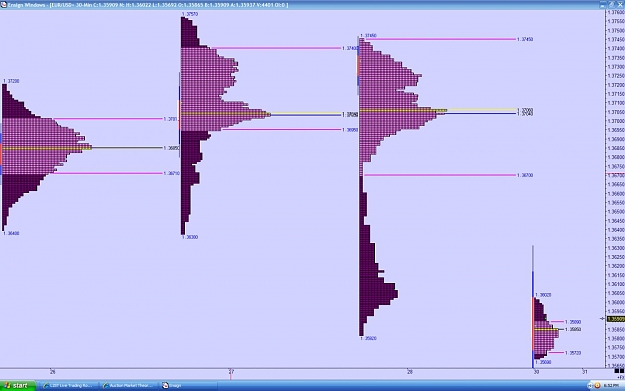
Here's what I have: technically we ranged on Friday. Both the Volume and Time POCs from Friday are higher by a few pips. I am using a 30 minute chart with a 24 hour histogram that starts at 1500 est.
Look a my previous post, I showed that we balanced lower (which is the white balance line). Also note that for me, a balance area is not nessaccarily the same thing as a value area.
**EDIT** : I am also using the CQG method to calculate it.
Attached Image (click to enlarge)
Without VSA, you're playing checkers while the Smart Money plays chess.
Joined Jan 2010
|
Status: I'm the greatest, man
|2,516 Posts
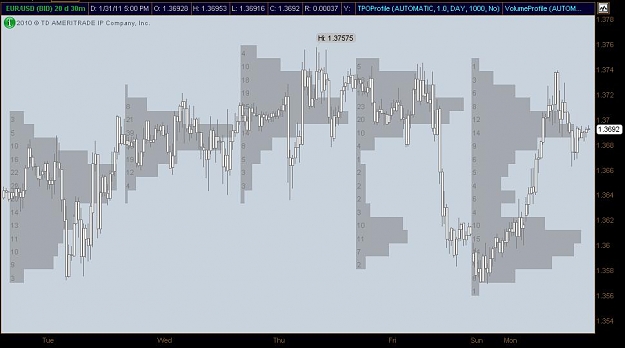
Looks like Monday's POC is going to end up lower than Fridays.
Here's a chart with the last 5 daily TPOs. Sure would be swell to be able to combine whichever TPOs I want. I'm in class now, hopefully I'll have time to highlight the areas I'll be watching going into tomorrow's trading.
Joined Aug 2009
|
Status: Reading the TAPE
|2,389 Posts
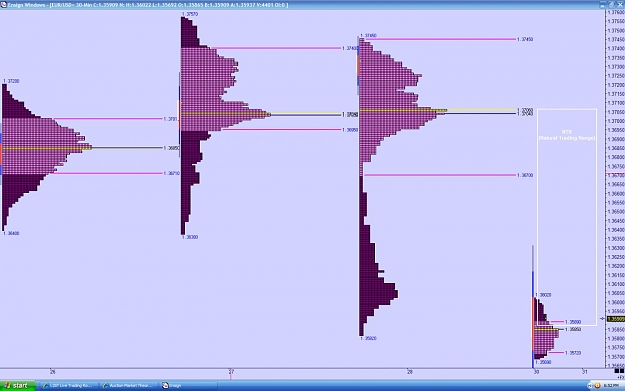
First a correction to my previous post. The start time is 1700 not 1500.
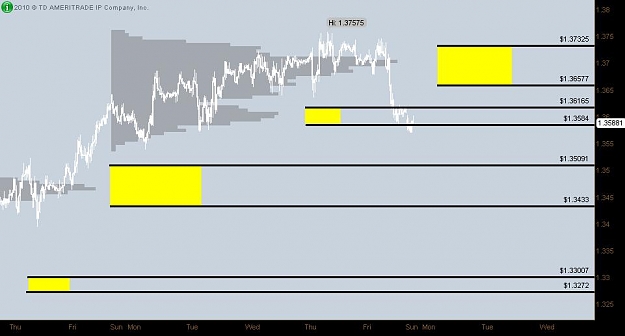
Okay now that that's done. Here's a new idea that worked out great today. Well, the idea is not new but it hasn't been introduced yet. I posted last night that if we broke above the balance area in white that the trend was up. I also posted that according to my charts, Friday's POC was actually still above Thursday’s POC despite the downside price action. Rising POCs define an uptrend-of course one day does not a trend make.
So here is the really cool thing. This concept comes from Enthios.com. Because we know that the POCs act like a magnet for price, we expect that price will trade to these POCs, especially one's that have yet to be re-touched.
Once the new day starts, the previous day's POC is considered naked unless of course the open is at the previous day's POC. The Jardine range or Natural Trading Range (NTR) takes the closest virgin POC above price and the closest virgin POC below the price for the most likely range price will trade today. One can see that this NTR can be very wide. But if you focus on the fact that the market is in a trend, you can narrow that range to the side of the trend. In other words, if the trend is up, then the Natural Trading Range would be from the open to the closest virgin POC above.
Of course today's example (last night's) worked out perfectly but we can not expect that to always be the case. Today's POC was lower than Friday's POC as Frankkn has mentioned. And one day does not a trend make. Generally, most people look for at least three. So the NTR for Today would be from the open to a POC above. Unfortunately, my data does not go back far enough to find one.
I'm sure we can work on some great ideas on how to use this. For me the basic idea is to re-enforce what type of trades to be taking. For last night, it was only long trades-at least until price hit yesterday's POC........
Attached Image (click to enlarge)
Without VSA, you're playing checkers while the Smart Money plays chess.
...The Jardine range or Natural Trading Range (NTR) takes the closest virgin POC above price and the closest virgin POC below the price...
...the Natural Trading Range would be from the open to the closest virgin POC above...
...one day does not a trend make. Generally, most people look for at least three. So the NTR for Today would be from the open to a POC above...
I'm sure we can work on some great ideas on how to use this.
Ignored
HG,
Thanks for sharing some dank nugs of info.
Now, the range idea you've put forth (be it Jardine or NTR); is that open to POC (above/below), or from POC above to POC below?
And yes sir I do agree that something truly excellent will come from practicing and theorizing this stuff.
I just finished an assignment and emailed it in just before the midnight deadline. I had forgotten about it until I noticed that I had written it down on the back of my hand.
It is very hard to keep my opinions to myself in this particular class. We're going over efficient market hypothesis, support/resistance, moving averages, indicators, fibs etc. My professor thinks I'm naive for paying attention to price and volume.
Just gotta remember that my grade is based on my prof's opinion and not reality (as well as my ability to smile and nod lol)
..Now, the range idea you've put forth (be it Jardine or NTR); is that open to POC (above/below), or from POC above to POC below?..
Ignored
As it is presented by Enthios, it is both the closest Naked POC above the open and the closest Naked POC below the open.
I'm positing that if the trend is up, then you only pay attention to the closest Naked POC above the open. And if the trend is down, you only pay attention to the closest Naked POC below the open. Thus is you are a trend trader, you have more reason to trade in the direction of trend as you "Know" where the market naturally wants to go.
In the Enthios universal method, one is looking to take a trade at whichever one gets hit first.
Without VSA, you're playing checkers while the Smart Money plays chess.
So here is the really cool thing. This concept comes from Enthios.com. Because we know that the POCs act like a magnet for price, we expect that price will trade to these POCs, especially one's that have yet to be re-touched.
Ignored
HG,
Thanks again for you priceless input, I'm now compiling another PDF book from this Thread. I believe it will be a great reference book for those who want to learn market profile in steroid.
What's your class you are participating in? Your professor is indeed naive.
Great thread, keep it up the good work
Ignored
It's called investing in securities. Everyone basically watches cnbc and loads up their fake portfolios with google every day.
The professor is pretty cool, she teaches indicators and the like but also suggests that they aren't too useful. While she covers trading I think she is a bit of a more long term investor. She believes in long term diversified portfolios full of companies that have quality financial statements and a reasonable future.
Only two more classes after this quarter and I'm done. Took me an extra year lol but I'm ready to be done with school.
As it is presented by Enthios, it is both the closest Naked POC above the open and the closest Naked POC below the open.
I'm positing that if the trend is up, then you only pay attention to the closest Naked POC above the open. And if the trend is down, you only pay attention to the closest Naked POC below the open. Thus is you are a trend trader, you have more reason to trade in the direction of trend as you "Know" where the market naturally wants to go.
In the Enthios universal method, one is looking to take a trade at whichever one gets...