Disliked{quote} 2. I still have serious problems to detect the direction of the underlying long term trend (breakout direction for 3-5 day balance). Too often there are bracket-tests that take my stop. I now try to detect the underlying long term trend, using monthly profiles with 1 day periods, because I think I place my stop in the range of some short term trends (intraday trends, short term traders) that go against my position and kill me every time. We are trading longer time frame and so we have to set our stops at that longer range or dont use stops....Ignored
The previous months MP is static it remains unchanged as the new month develops. And the developing new month will continue developing as its own profile, until a new month begins. The 70% Value Area is not what AMVT quantitatively considers a Bracket
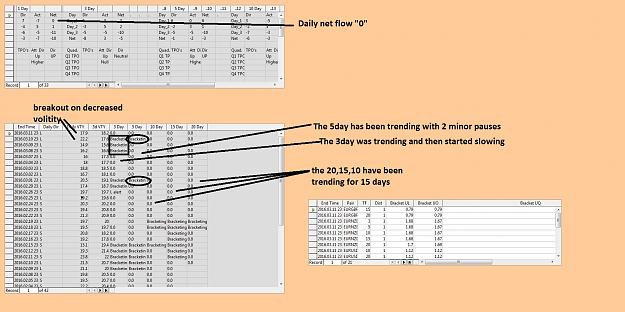
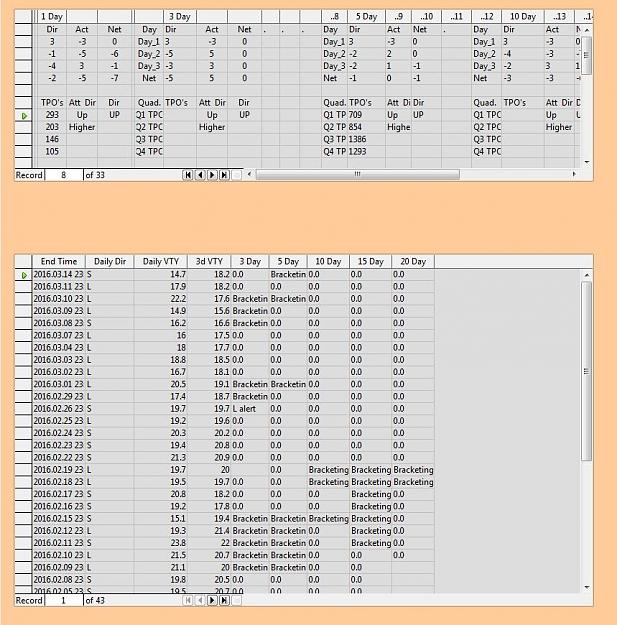
Auction Market Value Analytics, the 20day dist. each day is a fresh "snapshot" of the past 20 days of data (profiles)
i.e. lets say today is the 21st, so the 20day dist. for today is a "snapshot" made up of daily profiles from the 1st-20th.
The following day, the 22nd, the 20day dist. will be a "snapshot" made up of daily profiles from the 2nd -21st. The oldest days data (the 1st) is dropped, and the newest days data (the 21st) added to the dist.
The following day, the 23nd, the 20day dist. will be a "snapshot" made up of daily profiles from the 3nd -22st. The oldest days data (the 2nd) is dropped, and the newest days data (the 22nd) added to the dist.
This applies to all the timeframes.
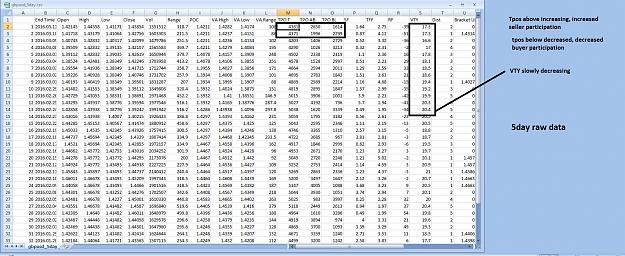
LTF traders who may have entered on the 1st will have either exited by taking profits, or will be still holding. By looking at the tpo count above & below the poc each day gives you a quantitative measure of that demand. If the total tpos are increasing below the poc, so is buyer participation. If the total tpos are increasing above the poc, so is seller participation. If the total tpos are decreasing below the poc, so is buyer participation. If the total tpos are decreasing above the poc, so is seller participation.
With MP youre looking at a static series of daily/weekly/monthly profiles.
With AMVT there is only one dist. /profile for each TF. And each day that dist. /profile either expands, contracts, or remains the same. The tpos increase or decrease, the shape of the dist, /profile shifts its shape as each day passes
Everyday will be a new "snapshot" of the condition of the market for that TF, and your daily analysis data/references gives you a quantitative measure of what has changed, where, and by how much.
The only thing Auction Market Value Analytics has in common with Market Profile, is that it uses the same tool/method for converting linear, 1 dimensional, price to price, time series, data into a 2 dimensional price*time format.
A monthly MP is not the same thing, nor is the term interchangeable to be the same thing as a 20day dist. used in Auction Market Value Analytics. A monthly MP is a static measure of a series of monthly profiles. AMVT uses a single dist. That changes its shape and info as each day passes.
Markets are not efficient, rather they are effective - Jones