The Balance Phase
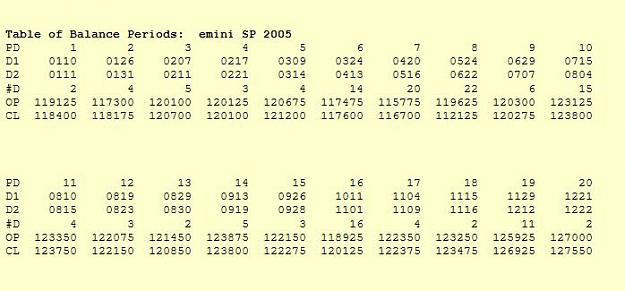
A balance may may be completed in a few days or may continue for many days or weeks. Over time, the balance range (support/resistance) may change slowly as the market responds to low level changing demand. A surge in demand will cause price to exceed the balance limits, causing a breakout.
The Directional Phase
Increasing demand drives the market directionally, e.g. in a trend. During the directional phase support/resistance is poorly defined. As the buying/selling pressure decays the trend loses steam and price movement slows. This effect is measurable as an increase in congestion. Directional markets often pass through several such slowings (pauses) until the final congestion grows into a new balance.
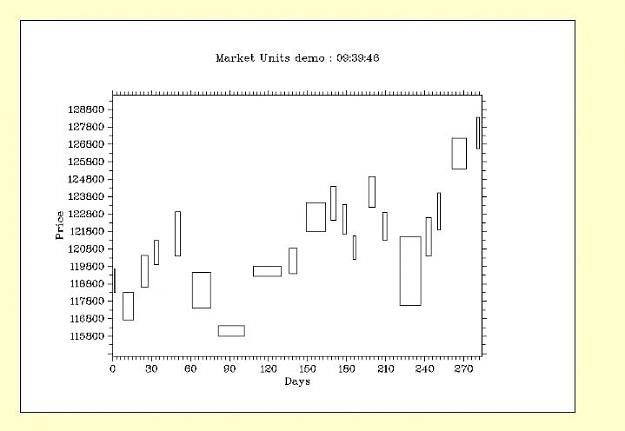
Details of a Market Unit Development Auction markets are complex systems. The path taken yesterday to go from price A to Price B will most likely not be the same if price goes from A to B today. A trader would like a simple rule, e.g. key trades off volume. But there are a number of important factors (called reference points), several of which may be the key factors at one time and different ones at another time.
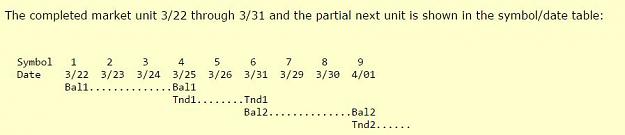
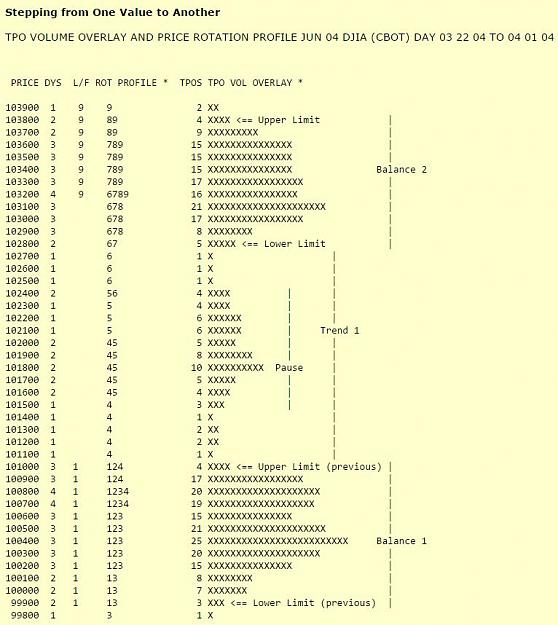
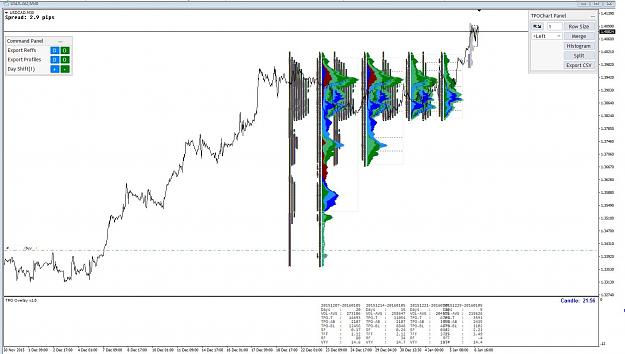
The complexity of markets suggests that the path from balance to run to balance might be complex itself. That is the case. An example path could be:
..Balance
..Internal rotation as the balance is maintained, point of control is stable, etc.
..Volume increases, internal rotation speeds up, trade facilitation is better (smaller)
..Price breakout from balance--maybe a run has started
..Price reverts back to balance (this was a false breakout)
..Price breakout from balance again
..Volatility increases, volume increases, value area is moving, etc.
..All this helps comfirm the run
..At some point the reference points ease off, value is steadying; the move is slowing
..A short, intra-day pause is seen (is the run over?)
..The pause is three days old and a balance cluster is clearly forming
..Point of control is in the middle of the distribution
..A new Balance has started
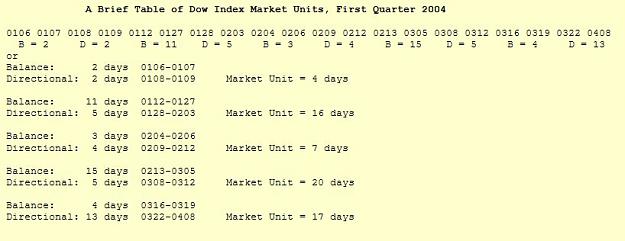
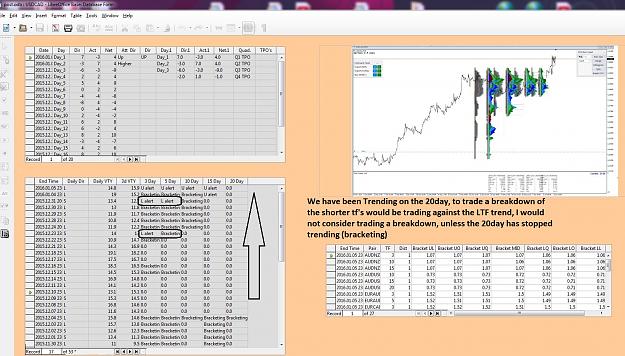
This is one scenario of many. It is the general outline of the market's behavior that is important. Run-to-pause-to-run-to-pause is a characteristic of auction markets. A trader needs to be able to recognize the outline as it develops. There are objective measures of balance (the Overlay methodology). Much of the decision making comes from experience, from subjective reading of the details as they unfold. As in most professions, the general features must known well before decisions can be made on the inner details (the surgeon must know anatomy well before the start of any surgery).
The Market Unit (tm)
By Donald L. Jones, March 17, 2005
Copyright 2005
A balance may may be completed in a few days or may continue for many days or weeks. Over time, the balance range (support/resistance) may change slowly as the market responds to low level changing demand. A surge in demand will cause price to exceed the balance limits, causing a breakout.
The Directional Phase
Increasing demand drives the market directionally, e.g. in a trend. During the directional phase support/resistance is poorly defined. As the buying/selling pressure decays the trend loses steam and price movement slows. This effect is measurable as an increase in congestion. Directional markets often pass through several such slowings (pauses) until the final congestion grows into a new balance.
Details of a Market Unit Development Auction markets are complex systems. The path taken yesterday to go from price A to Price B will most likely not be the same if price goes from A to B today. A trader would like a simple rule, e.g. key trades off volume. But there are a number of important factors (called reference points), several of which may be the key factors at one time and different ones at another time.
The complexity of markets suggests that the path from balance to run to balance might be complex itself. That is the case. An example path could be:
..Balance
..Internal rotation as the balance is maintained, point of control is stable, etc.
..Volume increases, internal rotation speeds up, trade facilitation is better (smaller)
..Price breakout from balance--maybe a run has started
..Price reverts back to balance (this was a false breakout)
..Price breakout from balance again
..Volatility increases, volume increases, value area is moving, etc.
..All this helps comfirm the run
..At some point the reference points ease off, value is steadying; the move is slowing
..A short, intra-day pause is seen (is the run over?)
..The pause is three days old and a balance cluster is clearly forming
..Point of control is in the middle of the distribution
..A new Balance has started
This is one scenario of many. It is the general outline of the market's behavior that is important. Run-to-pause-to-run-to-pause is a characteristic of auction markets. A trader needs to be able to recognize the outline as it develops. There are objective measures of balance (the Overlay methodology). Much of the decision making comes from experience, from subjective reading of the details as they unfold. As in most professions, the general features must known well before decisions can be made on the inner details (the surgeon must know anatomy well before the start of any surgery).
The Market Unit (tm)
By Donald L. Jones, March 17, 2005
Copyright 2005
Markets are not efficient, rather they are effective - Jones