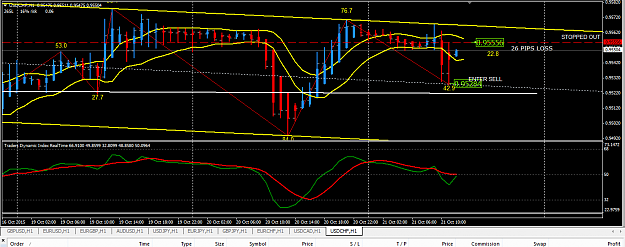
Not a good day for me, made a mistake, on trading a sell on the USD/CHF when it was near support, is on -13pips for the day, still got 2 hours to trade, hopefully I can make it up
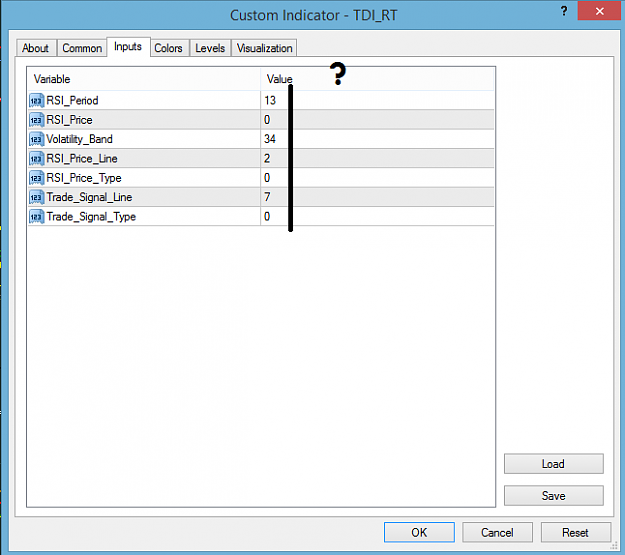
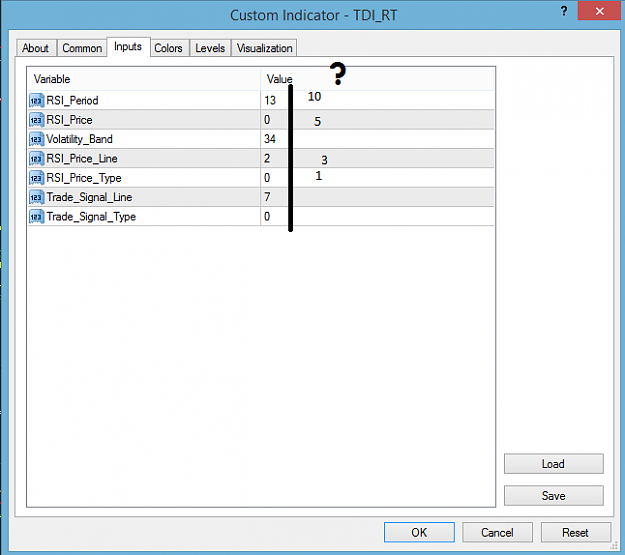
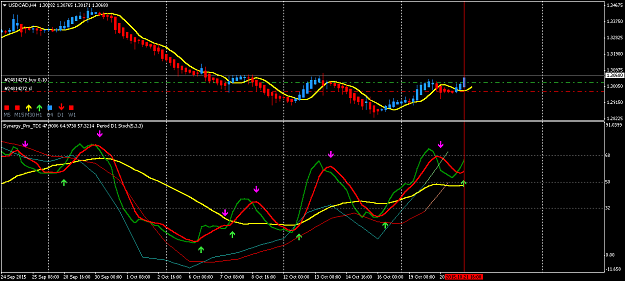
{quote} Thank you for all you try show us the correct way. I want to use as you said TDI_RT.mq4 Please write on picture what is the correct numbers I confuse. Thanks again. {image}
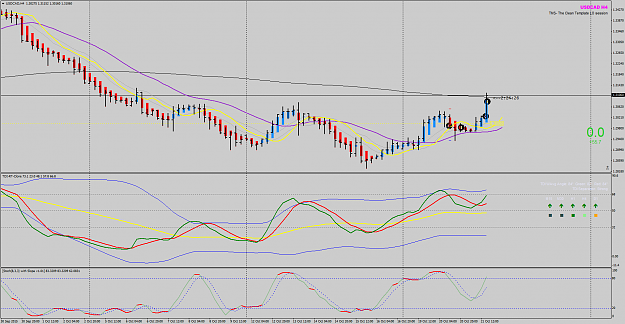
Here is a live trade taken a few moments ago. USD/CAD H4.
Not without risks (resistance, BoC news), but I've been using the D1 Stochastic (5,3,3) to try and filter out bad trades. On the attached chart I have it laid over the top of the TDI, but that's only because I'm currently working on a laptop with a small screen and I can't fit everything in separately.
Has anyone else used the MTF Stochastic with TMS?
I'm also in a sell trade on AUD/USD which is running at +20 pips.
{quote} Sir if I may ask, which pairs do you monitor and when do you start trading?
Ignored
I monitor EU, GU, EA, GA, EN, GN, GJ, EC, GC and Gold ....
But out of these pairs, any pair with ADR of above 100 pips over 5 n 10 days (average, again) qualifies to be traded on a particular day. I also observe PA, candle size etc.
As soon as I wake up (1 hour into Tokyo session) I observe these pairs on D, 4H and their relation to my adaptive trend line and 200 EMA. I also look for any divergences on HTF for any change in the trend ... and at this time I decide to be Buyer / Seller for any pair. Once I decide my bias, I ignore all opposite signals. Less confusions / ambiguity that way.
I prefer trading EA, GA, EN and GN from TO to NYO ...
other pairs from LO to LO Close ...
Hope it helps ............
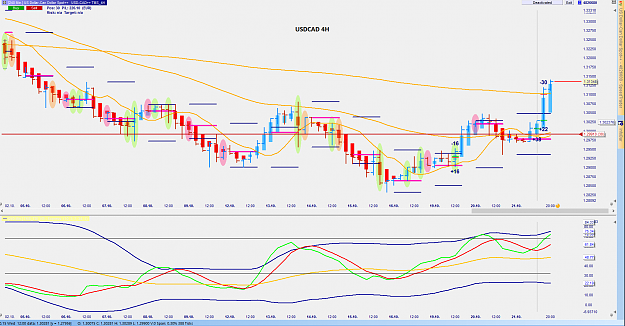
1st trade: early sell, mis tp, close on low momentum with small profit
2nd trade: standart buy, stoch confirms, tp 50, dont expecting big move, cuz D1 looks downtrend
1st trade: early sell, mis tp, close on low momentum with small profit 2nd trade: standart buy, stoch confirms, tp 50, dont expecting big move, cuz D1 looks downtrend {image}
Ignored
Nice second trade. I don't fully agree with Day chart being bearish. I saw a nice bullish signal on the daily bouncing off previous structure (1.2850)
Took a 4H signal and added second lot on the next bullish bar. Exited half at 200EMA and leaving the rest open for further profits.
What indicators are folks using for the current and average daily range? Thanks A
Ignored
You can use the Average True Range ATR indicator in your trading platform. No need to rely on MT4 indicators. Set the ATR to show the number of periods and read the value when you switch to Day chart TF to know the average daily range.
The number of days depends on you. I look at the past 100-days to be conservative. Some traders look at the past 7 days, some look at past 30 days.
There is no correct answer to this.
If you switch to Weekly chart TF, then it shows the average weekly range but again what is the number of weeks you want to know. I use 52-weeks (one year), again I am conservative and target 60% of this average weekly range.
Honesty is a very expensive gift. You wont find it in cheap people.WBuffett
{quote} Nice second trade. I don't fully agree with Day chart being bearish. I saw a nice bullish signal on the daily bouncing off previous structure (1.2850) Took a 4H signal and added second lot on the next bullish bar. Exited half at 200EMA and leaving the rest open for further profits. Best, {image}
Ignored
The Day chart was a buy setup after Monday close.But Tuesday was bearish day ... sort of pull back.
The same for EURCAD and GBPCAD. These pairs ran very nicely yesterday.Made lots of pips.
1st trade: early sell, mis tp, close on low momentum with small profit 2nd trade: standart buy, stoch confirms, tp 50, dont expecting big move, cuz D1 looks downtrend {image}
Ignored
good trades
the wonderful thing about trading 4H swing is that we can buy and sell in the same week....
this is a lot better than trading H1 intraday where you will suffer more losses and need to make up with more trades.
Honesty is a very expensive gift. You wont find it in cheap people.WBuffett
{quote} I monitor EU, GU, EA, GA, EN, GN, GJ, EC, GC and Gold .... But out of these pairs, any pair with ADR of above 100 pips over 5 n 10 days (average, again) qualifies to be traded on a particular day. I also observe PA, candle size etc. As soon as I wake up (1 hour into Tokyo session) I observe these pairs on D, 4H and their relation to my adaptive trend line and 200 EMA. I also look for any divergences on HTF for any change in the trend ... and at this time I decide to be Buyer / Seller for any pair. Once I decide my bias, I ignore all opposite...
Ignored
Hi,
I like this approach very much. When you use this approach consistently and have strict discipline when trading, you will not only make lots of pips and money, but you will grow your account and achieve your financial goal.
regards,
Honesty is a very expensive gift. You wont find it in cheap people.WBuffett
Here is a live trade taken a few moments ago. USD/CAD H4. Not without risks (resistance, BoC news), but I've been using the D1 Stochastic (5,3,3) to try and filter out bad trades. On the attached chart I have it laid over the top of the TDI, but that's only because I'm currently working on a laptop with a small screen and I can't fit everything in separately. Has anyone else used the MTF Stochastic with TMS? I'm also in a sell trade on AUD/USD which is running at +20 pips. {image}
Ignored
Good trade.
The H4 setup was good. Typical Big E type of H4 trade setup.
No need for MTF Stoch.
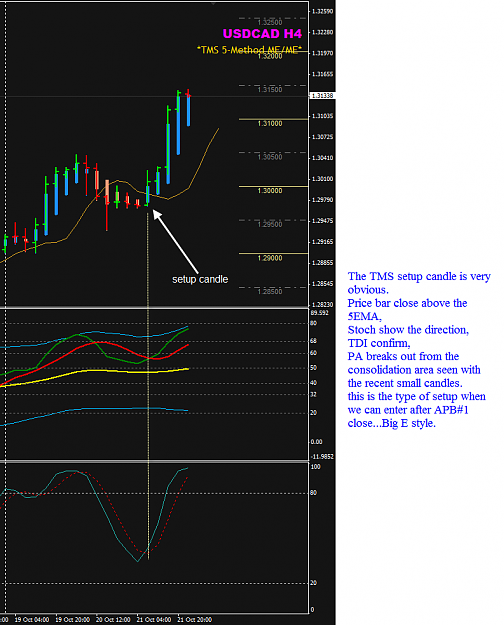
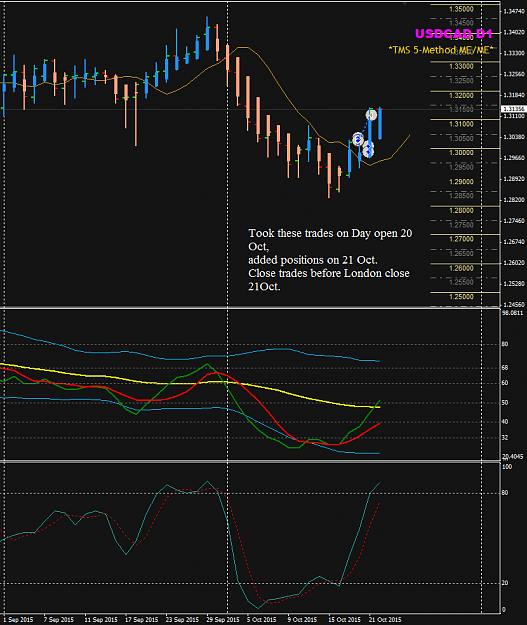
I traded the Day chart setup on Tuesday 20 Oct and use the H1 and H4 to add more positions yesterday. Great trading day it was.
Attached Image (click to enlarge)
Day chart trades below:
Attached Image (click to enlarge)
Honesty is a very expensive gift. You wont find it in cheap people.WBuffett
{quote} Thank you for all you try show us the correct way. I want to use as you said TDI_RT.mq4 Please write on picture what is the correct numbers I confuse. Thanks again. {image}
Ignored
Hi,
There is no correct way or wrong way. what is important is to understand what each of those setting means and how each setting will show what happens on the price chart.
The major difference is the use of Typical Price (5) instead of the Close price (0). Typical Price includes the high low of the candles and we will see less of those sharp angle turns in the TDI Green line. This will affect your exit strategy when you use the Typical Price.
When you use the Close price, and when the price makes a pull back below the previous close, the TDI Green will hook backwards. This is Big E' exit condition.
I don't use this exit condition when I set my TDI to Typical Price the same way Dean Malone set his in his Synergy_Pro_TDI. This way I stay in the trade longer and 'let profits run'.
regards,
Honesty is a very expensive gift. You wont find it in cheap people.WBuffett
H4 continue his short (long term) ? {image} EDIT : maybe next time , it lost -14 pips
Ignored
Good to view the lower TFs. Very noisy down there and will kill many day traders.
I could not get any pips out of this EU this week. Got to wait longer and see what happens to USD and when the 3 amigos AU, EU, and GU ride in the same direction, then maybe I get a good trade later.
Honesty is a very expensive gift. You wont find it in cheap people.WBuffett
Wanted to post this one as not every trade will work, I still learn as you all here, into next one {image}
Ignored
Hi,
I like your honesty. We all have losing trades. We learn from our losers and also our winners.
We are all right until the market proves us wrong. Then we move on to the next opportunity.
No need to be emotional about every losing trade because that's the life of being a full time trader.
regards,
Honesty is a very expensive gift. You wont find it in cheap people.WBuffett