{quote} TSS, you are still using that TDI Red Green which re-paints? have you compared the TDI realtime version? regards,
Ignored
Yes Emmanuel I got red out of that painting indicator , TDI RT , used it for one whole year and I thought I was on the rite side, then I learnt about Phx62 Trader Dynamic Index, and to me thats the ones that should be used
So just my 2 cents, I dont intend here to forget that the ones that did that indicator has done big job in helping TMS forum, thanks a lot, my regards and respect
I Have Learned to Take Some Losses to Make Profits
{quote} Yes Emmanuel I got red out of that painting indicator , TDI RT , used it for one whole year and I thought I was on the rite side, then I learnt about Phx62 Trader Dynamic Index, and to me thats the ones that should be used So just my 2 cents, I dont intend here to forget that the ones that did that indicator has done big job in helping TMS forum, thanks a lot, my regards and respect
Ignored
I also use the one that changes only at the close of the candle, after all it shows you the last closed candle, you can't count PA until the candle closes anyway so why watch a tdi go up and down along with the working candle. It only matters that something repaints when backtesting it, not when trading it live.
Firstly thanks for all your great contributions to this system.
Regarding the entry in 'real time', don't you have the risk that price might spike up, triggering a buy entry, but then the candle closes bearishly and TDI doesn't cross?
My assumption was that you enter on the close of the candle? Real time entries also make it impossible to backtest?
{quote} Yes Emmanuel I got red out of that painting indicator , TDI RT , used it for one whole year and I thought I was on the rite side, then I learnt about Phx62 Trader Dynamic Index, and to me thats the ones that should be used So just my 2 cents, I dont intend here to forget that the ones that did that indicator has done big job in helping TMS forum, thanks a lot, my regards and respect
Ignored
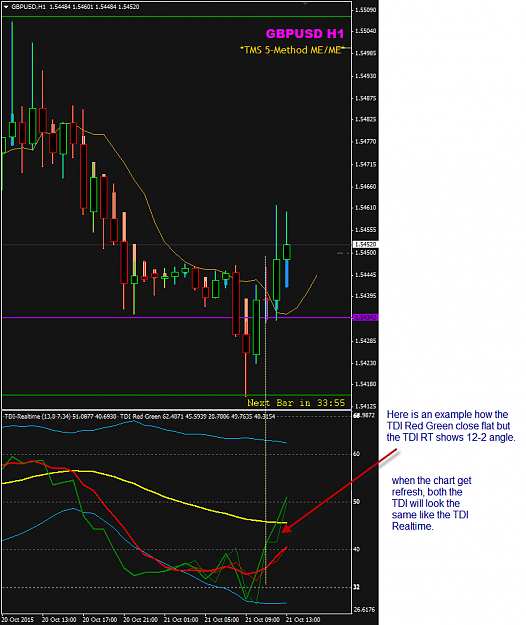
My observation is that most traders posted their winning trades after the TDI Red Green had being refreshed and repainted. The chart do not actually show how the TDI Red Green look in actual trade setup in realtime.
Of course we all must wait for the candle to close to confirm the trade setup, but the issue is in the repainting of the TDI green line in history and when traders do their back-testing by scrolling back to history charts, the setups look perfect. This is not the case in realtime market condition. The better way to do backtesting is to run it using the strategy tester and you will see how the TDI Red Green reacts to actual RSI data change.
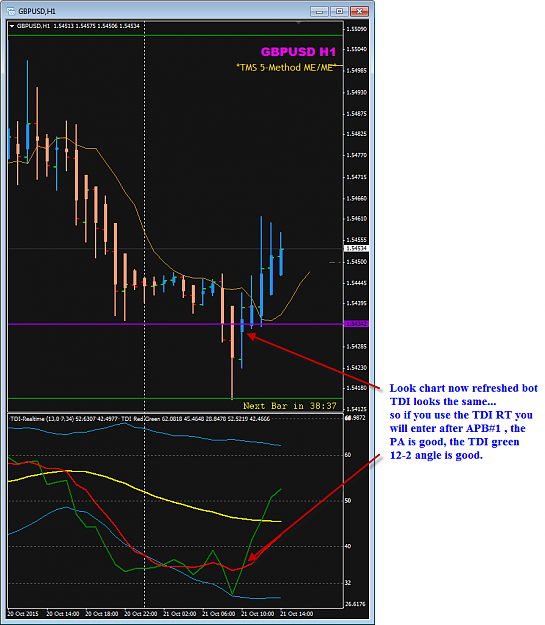
GBPUSD H1 example below:
Attached Image (click to enlarge)
Honesty is a very expensive gift. You wont find it in cheap people.WBuffett
Joined Jun 2015
|
Status: everybody trade at one`s own risk
|648 Posts
moin
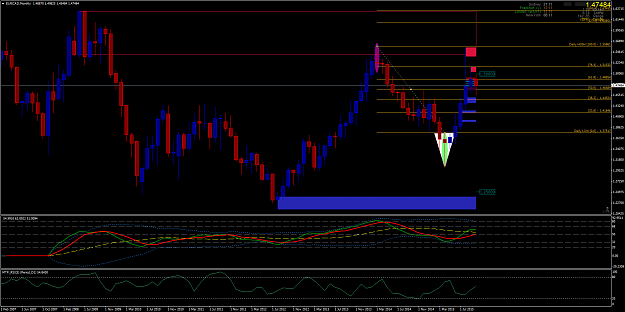
example EURCAD for all intrested traders . Take a look at monthly chart and play a little with your fib tool
on the top and bottom candle , you can see how open close of the last two monthly candles correspond with it.
Don t forget S/R levels when trading TDi
Attached Image (click to enlarge)
green pips to all
from level to level - you need mental strength to reach the summit
{quote} My observation is that most traders posted their winning trades after the TDI Red Green had being refreshed and repainted. The chart do not actually show how the TDI Red Green look in actual trade setup in realtime. Of course we all must wait for the candle to close to confirm the trade setup, but the issue is in the repainting of the TDI green line in history and when traders do their back-testing by scrolling back to history charts, the setups look perfect. This is not the case in realtime market condition. The better way to do backtesting...
Ignored
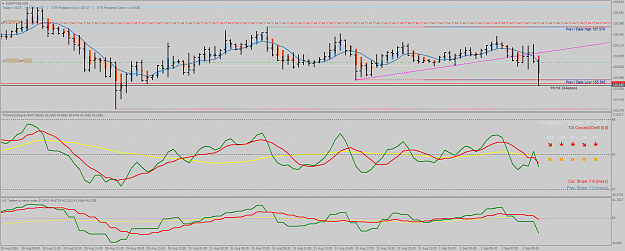
Your observation is incorrect. When I posted this trade and numerous others I was using the watchdog without the refresh which is my favourite to use, look at the watchdog figures, that along with PA and H1 is what made me enter the trade, that was set at the close of the candle before so I don't care if it repaints later on, the fact is, that was what it looked like at the beginning of the candle live trading.
{quote} Hello, Since I am a new guy, can somebody tell me how shall I add the those 3 lines to TDI? (2 blue and 1 yellow) as I assume it's boilinger bands. Answer will be appreciated !
Ignored
those lines are already in the TDI indicator.
you can set them under the Indicator Properties.
Attached Image
Honesty is a very expensive gift. You wont find it in cheap people.WBuffett
{quote}Your observation is incorrect. When I posted this trade and numerous others I was using the watchdog without the refresh which is my favourite to use, look at the watchdog figures, that along with PA and H1 is what made me enter the trade, that was set at the close of the candle before so I don't care if it repaints later on, the fact is, that was what it looked like at the beginning of the candle live trading. {image}
Ignored
I don't know which watch dog you have.
I am not interested to discuss anything with you.
Honesty is a very expensive gift. You wont find it in cheap people.WBuffett
{quote} I don't know which watch dog you have. I am not interested to discuss anything with you.
Ignored
surprise surprise. I am not interested in discussing anything, I am interested in pointing out to those that read your posts that it is a misconception. Even in your example above with GU, the fact is the tdi went flat because that bar closed a doji and that shows indecision not a bullish candle.
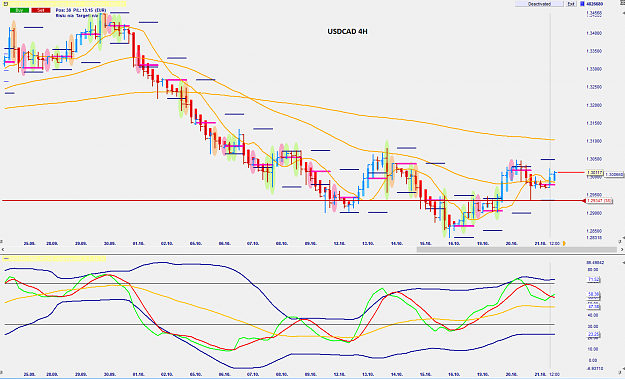
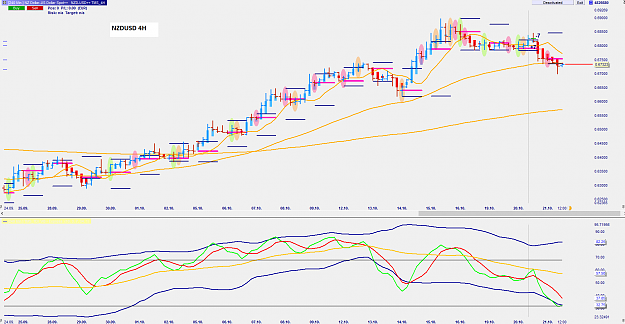
following USDCAD bullish day I saw 4H close above 5EMA / 50EMA. Green has not actually crossed on this bar only at the open of the new bar. Thus, if this bar closes very bearish it's possible there was no cross? Is this too aggressive entry?
I would like some feedback also on NZDUSD 4H entry. LT bias is up. 4H closed above day IB but trade immediatly went against me. Did I miss something here?
{quote} Hi Emmanuel Firstly thanks for all your great contributions to this system. Regarding the entry in 'real time', don't you have the risk that price might spike up, triggering a buy entry, but then the candle closes bearishly and TDI doesn't cross? My assumption was that you enter on the close of the candle? Real time entries also make it impossible to backtest? Would love you insight. Thanks
Ignored
Hi,
It is very important that we wait for the candle to close and confirm with the setup candle with TDI Green cross Red or the TDI Green shows 12- 2 or 4-6 clock face angle. If the price spike and pulls back, then the Close of that candle will show if there is a setup.
Here I am talking about two versions of the TDI - the TDI Red Green (re-painting version) and the TDI RT which is a realtime version. Both have the same setting parameters and set to the Close price.
When it is mention realtime, it does not mean live market feed price data. You can run MT4 strategy tester, place both TDI versions on the same chart and you will see both TDI version data reacting to the same historical price data. You will see the difference candle by candle.
There are many other versions posted in this thread by other members and I don't talk about them here. Just the one Big E posted at the beginning of his thread and then X-Man posted the realtime version in his H1 thread.
Note: Big E sometimes enters a trade during APB#1 (before it closed) without seeing the setup candle. He used the TDI Red Green without refreshing his charts when he trade. He mention this many times when members asked. He is very aggressive in his entry and likewise he pull out of his trade very quickly too. He is top class reversal trader on H4.
Hope this helps.
regards,
Honesty is a very expensive gift. You wont find it in cheap people.WBuffett
{quote} surprise surprise. I am not interested in discussing anything, I am interested in pointing out to those that read your posts that it is a misconception. Even in your example above with GU, the fact is the tdi went flat because that bar closed a doji and that shows indecision not a bullish candle.
Ignored
I thought you once posted that you will only post in the M30 thread. You missed this thread....
Honesty is a very expensive gift. You wont find it in cheap people.WBuffett
{quote} I thought you once posted that you will only post in the M30 thread. You missed this thread....
Ignored
I'll go back to the other thread I think, there they teach people to actually trade what they see, just a shame that so many people are getting led to the slaughter, how do I know? Because of the amount of people that ask me for help after trying out what they're reading here and wonder why its not working, funny that, I find it very surprising, that after all the posts you've made, all the people that come onto the thread praising your posts, that there are still so many losing and losing big time.
Here is the same GBPUSD H1 chart after I refreshed it.
No flat TDI Green like the TDI RT.
Attached Image (click to enlarge)
So you decide which version you want to use in your live trading.
If you want to trade H4 like Big E the way he described in Post#1, please use the TDI Red Green like him. It work provided you have his experience.
Honesty is a very expensive gift. You wont find it in cheap people.WBuffett
{quote}I'll go back to the other thread I think, there they teach people to actually trade what they see, just a shame that so many people are getting led to the slaughter, how do I know? Because of the amount of people that ask me for help after trying out what they're reading here and wonder why its not working, funny that, I find it very surprising, that after all the posts you've made, all the people that come onto the thread praising your posts, that there are still so many losing and losing big time.
Ignored
Fact is 95% of traders lose their money including you.
Not becasue of the trading method. It is in your mind.
Honesty is a very expensive gift. You wont find it in cheap people.WBuffett
Here is the same GBPUSD H1 chart after I refreshed it. No flat TDI Green like the TDI RT. {image} So you decide which version you want to use in your live trading. If you want to trade H4 like Big E the way he described in Post#1, please use the TDI Red Green like him. It work provided you have his experience.
Ignored
No, it worked for Big E, me, TheScorpS and phx62 and numerous others out there.
{quote} Hi, It is very important that we wait for the candle to close and confirm with the setup candle with TDI Green cross Red or the TDI Green shows 12- 2 or 4-6 clock face angle. If the price spike and pulls back, then the Close of that candle will show if there is a setup. Here I am talking about two versions of the TDI - the TDI Red Green (re-painting version) and the TDI RT which is a realtime version. Both have the same setting parameters and set to the Close price. When it is mention realtime, it does not mean live market feed price data....