Disliked
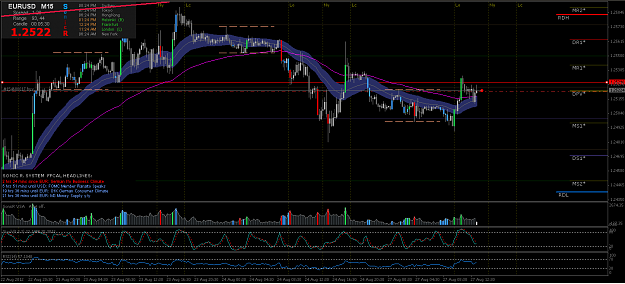
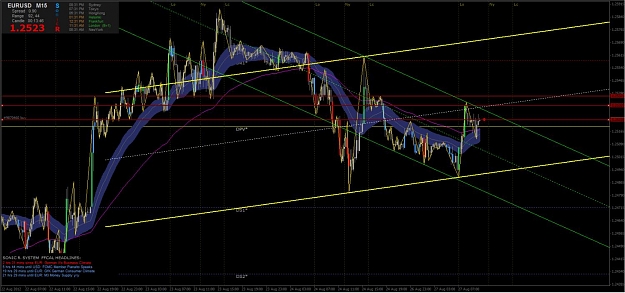
What I see is that you are focusing on the volume bars that represent 200%+ average volume for a 20 bar period. Of the 6 bars you highlighted, only 4 seem to fit in with a Sonic R. setup breakout, the 1st, 2nd, 5th and 6th. Of those 4, only 3 setups have a breakout in the direction that would have been anticipated, the 2nd, 5th and 6th. And of those 3, the last 2 are really for the same breakout. So, with only a 2 moves out of 6 moves ratio of success, I am unsuccessfully trying to understand what it is here that you are saying.Ignored
and here is h4 chart , your last template.
62 bar volume average colour , and i see only 7 false bar signal.
Attached Image (click to enlarge)