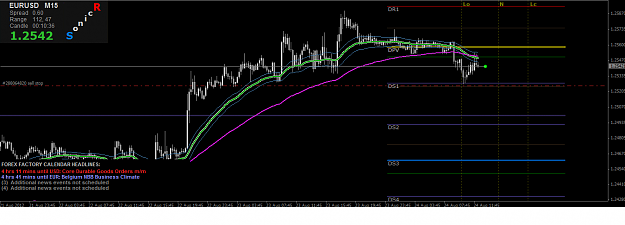
i need good 1 2 3 wave
- #38,863
- Aug 24, 2012 3:07am Aug 24, 2012 3:07am
- Joined Mar 2008 | Status: PVSRA with Traderathome | 23,555 Posts
- #38,864
- Aug 24, 2012 3:24am Aug 24, 2012 3:24am
- Joined Feb 2009 | Status: Down to Earth! | 2,358 Posts
fooled by randomness in art
Meditation All Time Return:
8.9%
- #38,866
- Aug 24, 2012 4:13am Aug 24, 2012 4:13am
- Joined Mar 2008 | Status: PVSRA with Traderathome | 23,555 Posts
- #38,868
- Aug 24, 2012 4:31am Aug 24, 2012 4:31am
- Joined Mar 2008 | Status: PVSRA with Traderathome | 23,555 Posts
- #38,870
- Aug 24, 2012 4:41am Aug 24, 2012 4:41am
- Joined Feb 2009 | Status: Down to Earth! | 2,358 Posts
fooled by randomness in art
Meditation All Time Return:
8.9%
- #38,876
- Aug 24, 2012 8:15am Aug 24, 2012 8:15am
- Joined Mar 2008 | Status: PVSRA with Traderathome | 23,555 Posts

- #38,877
- Aug 24, 2012 8:30am Aug 24, 2012 8:30am
- Joined Mar 2008 | Status: PVSRA with Traderathome | 23,555 Posts
- #38,880
- Edited 9:40am Aug 24, 2012 9:19am | Edited 9:40am
- Joined Mar 2008 | Status: PVSRA with Traderathome | 23,555 Posts