Same here -- Good one, thanks.
That, or similar fractal imagery, can guide me on where to concentrate my thoughts, when drawing some of a list of devices on charts and when stopping a trade in its planned area for something I may've missed.
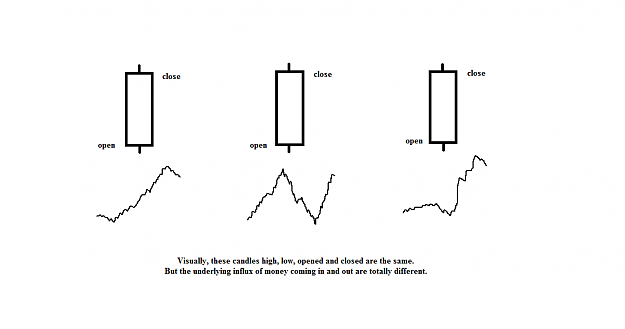
It freely moves between areas, unlike restrictive / single-area (cycle, trendline, resistance, etc.) examples.
The only comparable I have is to focus as much as can on a random-size area, and then "Just go for it all!" in however long the trade takes to fulfill or falsify the reason -- test-phase imagery too risky for real trade.
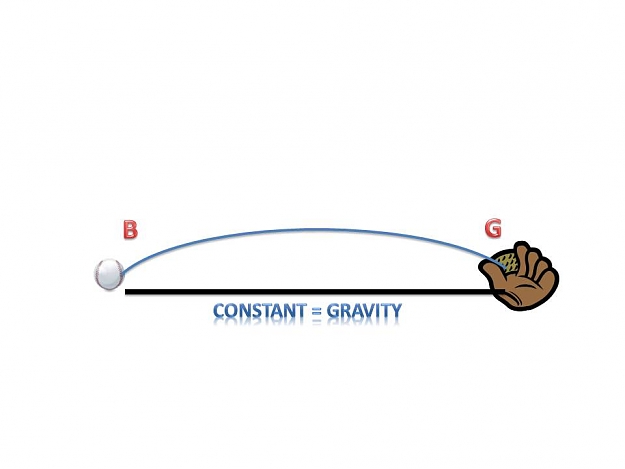
DislikedThis structure apply to a plant in the same way as it apply to the market, what is the market then, the price activity.
It is simply the exploration of the market structure (the market branches), in this process the price go exploring the various branches, every of them
...
So, in the market plant, we will see some branches with many littler branches attached to him, big powerful full of life branches, big amount of money join the market, the volume is high, great big trends that move the market far away in one direction.Ignored
It freely moves between areas, unlike restrictive / single-area (cycle, trendline, resistance, etc.) examples.
The only comparable I have is to focus as much as can on a random-size area, and then "Just go for it all!" in however long the trade takes to fulfill or falsify the reason -- test-phase imagery too risky for real trade.