This was started at the beginning of 2011, and the first 2 weeks' results are encouraging, therefore it tempted me to go public with it. If this does work out good, it might give some interesting approach to fellow traders, so it would be good to have a record of it. If it doesn't work out, it would still be a good record as something to avoid
The main idea is to hold a basket of trades through the whole year and close them at the end (December 31, 2011). The question of course is WHAT is in that basket.
I noticed at the end of last year the following interesting things:
- AUD, NZD, CAD, CHF and JPY were at/near all-time or multi-year highs against the USD
- EUR and GBP were 1000's of pips away from their all-time highs against the USD
- Almost all the crosses between one pair of the first group and one pair of the second group were also at/near all-time or multi-year highs against the EUR or the GBP
Observation (3) above looks like a direct consequence of observations (1) and (2) so you might say, what's the big deal?
Well, this did lead me to conceive a possible trading approach which would offer a very good risk/reward for a yearly trade basket. I would define this as a set of trades with equal lots taken at the beginning of the year and closed at the end of the year.
Why would I be looking for something like that? Well, simply to minimise involvement, stress, anxiety and any other emotion or thing that affects daytrading. I work my (small) live account with an intraday strategy that I am trying to perfect, but I usually find it extremely demanding on my emotional fuel.
And having heard a thousand times that larger timeframes give stronger signals, I thought to give it a go with the yearly one. There are quite a few threads here that work on the Daily, Weekly and Monthly timeframes, so I wanted to add some new perspective, if I can.
In order to give credits where due, I took my long-term trade inspiration from a few places here in FF and more specifically:
- The "Building an equity milllipede" thread, and specifically the posts of PipEasy - http://www.forexfactory.com/showthread.php?t=245149
- The "No free lunch (DIBS)..." thread, and specifically the posts of Peter Crowns - http://www.forexfactory.com/showthread.php?t=56907
- Some posts by TheRealThing, both in FF and his blog - http://www.forexfactory.com/therealthing
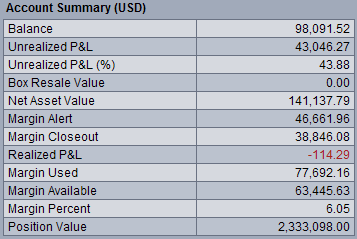
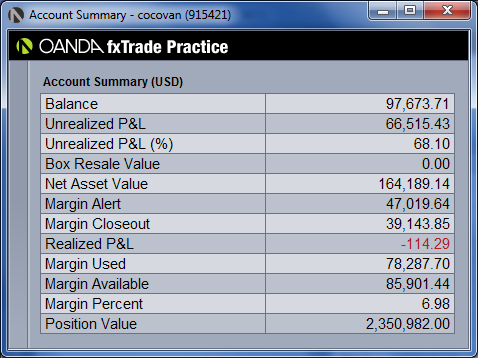
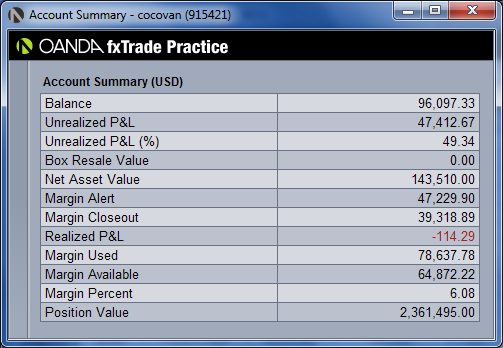
On January 16, my demo account at Oanda where I am trying this, is already up 50% from the start of the year, with a 3% initial drawdown for the moment. I must admit that the leverage I used is over the top, and I would be much safer trading 1/10th the amount I have now, so the more conservative result would be a 5% account increase inthe first 2 weeks. But THIS IS A DEMO, so I do not mind the end result.
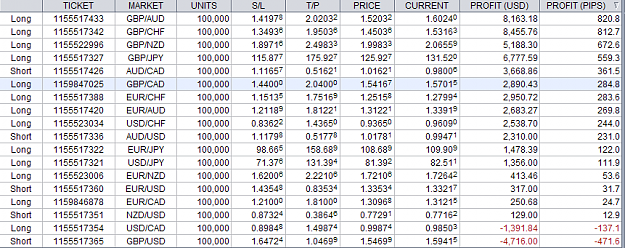
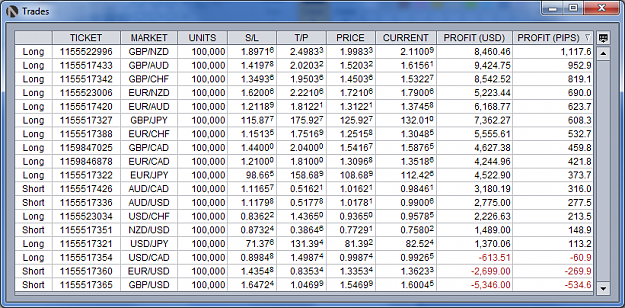
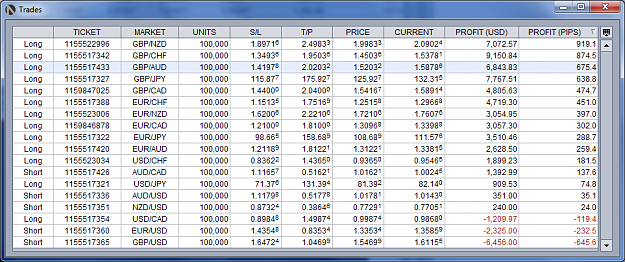
The trades taken on December 31st 2010 were:
- Group 1: Short EURUSD,GBPUSD,AUDUSD,NZDUSD and Long USDJPY,USDCHF,USDCAD
- Group 2: Long EURAUD,EURCAD,EURCHF,EURJPY,EURNZD
- Group3: Long GBPAUD,GBPCAD,GBPCHF,GBPJPY,GBPNZD
- Group 4: Short AUDCAD
Group 1 is obviously a multi-pair USD long. The logic behind it is that since USD is in such a multi-year low point against 5 of the 7 most traded other currencies (AUD,CAD,CHF,JPY and NZD), this year should bring at least some retrace of the last few years' moves. As for the EUR and GBP, there is nothing fundamentally that makes them so strong against the dollar, therefore I would think that if the dollar will actually appreciate in general, EUR and GBP will follow this trend and fall against it.
Group 2 basically says that as the dollar appreciates through 2011, there is probably more upside against the 5 pairs mentioned above (AUD,CAD,CHF,JPY and NZD) than against the Euro, which has already been hit hard in the last 3 years. Add to that some very interesting bottom-side wicks on a YEARLY EURUSD chart for 2008, 2009 and 2010. All in all, I expect the EUR to depreciate LESS against the dollar compared to those 5 currencies.
Group 3 is a similar case for the GBP. Again, the pound has already suffered a huge decline in 2008, and there are some nice bottom-side wicks in the Yearly GBPUSD chart for 2009 and 2010. So again, I expect the GBP to depreciate LESS against the dollar compared to those 5 currencies above.
Group 4 is the misfit trade, I might add to this group during the year if I see something good developing in any other pair. I just saw that AUDCAD was also at its all-time highs, and simply thought to give it a try shorting and see how it goes.
Before you think that the logic of selling at the top and buying at the bottom is flawed, because nobody knows if the market will continue rising or falling respectively, let me say that I've been burned more than enough times trying to pick tops and bottoms in M5,M15 and H1 charts, and you probably know what I am talking about. But in a Yearly chart ??? I am thinking that this should make a difference. There are also several positive things about trying a basket of trades like the one I described which, in my view at least, minimize the risks involved.
I will post more details following, plus charts and frequent account updates.
If you see me stop posting, you will know that the demo account has been blown to ashes ![]() . Feel free to embarass me further on such an occasion.
. Feel free to embarass me further on such an occasion.
Happy trading to all,
Christos