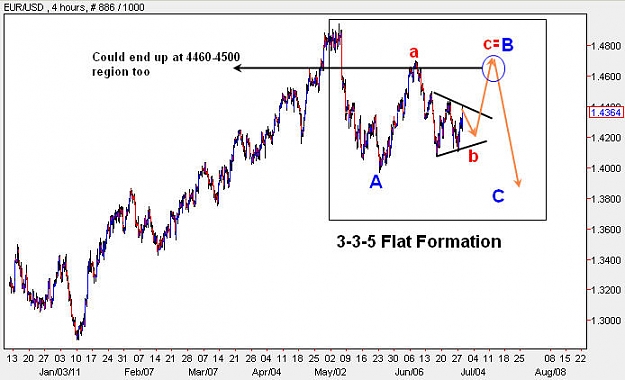
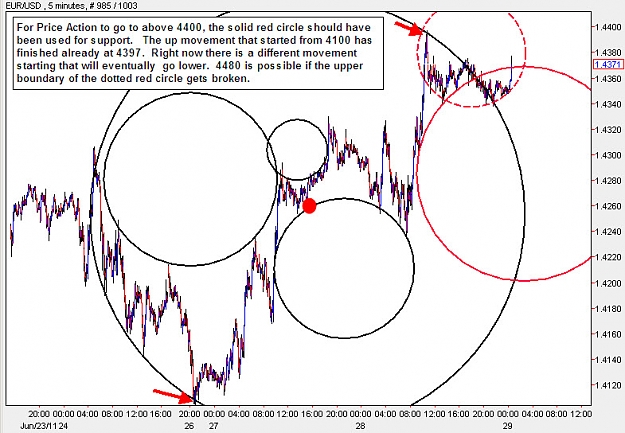
For those interested in some Elliot Wave Analysis, this is what I posted on the EUR/USD thread, but I couldnt get the hyperlink reference to that post proper, so I am posting it here as well
Circular Trend-Waves 414 replies
How do I change the color of trendlines? 2 replies
Too many drawn Trendlines all same look: how to draw Trendlines with different look? 2 replies
Recommend an ebook on trendlines.... 10 replies
Short trendlines 7 replies
DislikedSo, now that it hit 1.44 it dropped back down but appears to be building againIgnored
DislikedSince the EUR did not drop to 4340, there is a probability on the M5 time frame that it could hit 4407 by the openning of the Asian session. It is pushing itself upward towards 4400 territory and if it goes above 4410 it can go higher to 4480 as well. I am not posting charts yet till the Asian session opens later tonight. But just trying to do my best to give everybody some info.Ignored
DislikedIf the movement goes up then according to a previous post, its limited by 4480-4520 region:
http://www.forexfactory.com/showthre...64#post4728564
And a good size sell awaits in that regionIgnored
DislikedI have to refer to this post:
http://www.forexfactory.com/showthre...98#post4733298
To try to integrate it with the circle scenario on the H1 time frame, because thats the best way to describe the wild swings that we are having since June 16:
Right now for this pair to go to 4480 region, which is roughly where the green curve is located, it had to be at 4405 by now, and created a support level at around 4380. It hasnt done that, which means we have to consider another leg dropping to 4200 region before a final thrust...Ignored
DislikedWell, my 1HR and 15M chart was telling me it was heading down last night. I wake up this morning and it had headed up. My 15M chart looked like the PA exited two different circles (one out the exited the east region and the other existed the south east region) went out into empty space for an hour or two and then just turned up.Ignored
DislikedThe upper curve on a previous post by Traderfitz is the subject of my attention right now. The turnaround that I was expecting might have started:
http://www.forexfactory.com/showthre...17#post4730417Ignored
DislikedYes, you did.
Some time has passed, but I guess the curve should be the same. I am trying to redraw it on M15/M30 to see what happens.
But it got hit right on the money, and the lower circle is getting a severe beat.
We will have to see whether the spike will be the needle that will burst the bubble.
If that is the case my scenario of a dip to 4200, was gonna happen a bit higher up and not at 4397.
AND back to the same belief that trends dont start in June / July.
But still I am on the side line.Ignored
DislikedThe M30 one right now draws better, since I cant get some of the points on the M15.
2 Thumbs up to you TraderFitz
But still speculative...Ignored
DislikedI would be very wary if I was you. Usually the market does the exact opposite of what I think it should do. I call it the "TraderFitz trap". You have heard of bull traps and bear traps but there is a "TraderFitz trap" as well. This may be one.Ignored