How to forecast the market using curved lines and circles.
Introduction
The information that is posted here was not taken out of a book or text, it is purely my own interpretation of a concept twisted into a curve that I have been experimenting with for the past 2 years, and that is using curved lines as points of resistance and support on a chart and the behaviour of price around these levels.
The Concept
There are many methods of technical analysis, which all have their plus and minuses, but the ultimate decider of the market is price, and price will do whatever it wants to do, disregard of what a mathematical interpretation of it. Market moves because of excitement and fear of traders. These emotions create different levels of price, and form lines and curves which can be used to analyze future movements
This method is based on the above concept.
Any movement that the market does, will always fall on a point, and the point that it lands on will be on a path where there has been other points in the past along that path.
So if we can find the path, we can find the point, and if we can find the point we can deduce the path. Once the path / points are found, then the acceleration of price through this space and the time a movment spends within a certain path must be noted to help in proper judgement of direction and opportunities for a safe trade.
Putting the path, points and the speed of the motion together is what this method focuses on.
Some Basic Principals
Understanding resistance and support is the most important fact in trying to deduce what the market is doing and where its heading.
There are 3 different kinds of support and resistance, but most people are only familiar with 1 or 2. The 3 kinds are:
1. Support or resistance that lines on a horizontal straight line
2. Support or Resistance that lines on a slanted straight line, most literature refer to this as a trendline.
3. Support or Resistance that lines on a cruved line. Again this is also a trendline, but its curved in space and is the main subject of this thread.
There are few rules to follow when analyzing price along a trendline, whether it be horizontal, slanted or curved.
1. Price moves from trendline to trendline
2. If price shows stickiness to a trendline, then it will break that trendline 90% of the time.
3. Once a trendline breaks price moves to the other more significant trendline.
4. Price never stays in between 2 trendlines.
Basic Tools
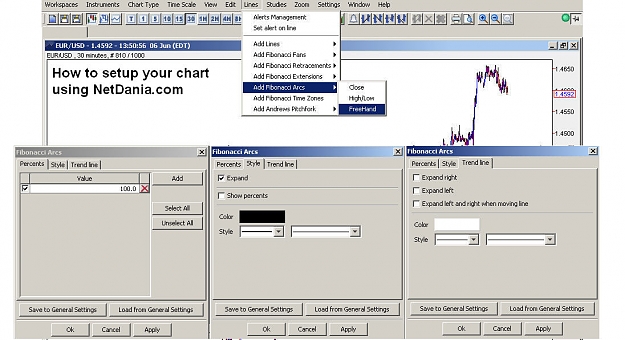
All charting software have a fibonacci tool that draw fibonacci arcs, few of them have a circle drawing tool, but you need to be able to draw only the perimeter of a circle, a solid circle creates a bit of confusion. I am going to use a example of how I modified the fibonacci arc tool to use it to draw circles. The chart I use can be found here:
http://www.netdania.com/Products/liv...rtStation.aspx
Check this post to get better explanation on how to configure NetDania.com to draw circles:
http://www.forexfactory.com/showthre...81#post4679881
The drawing below shows how to modify the tool to create a circle.
Also note that you need to see a lot of points on your time frame. Having a CandleStick chart where you see every wick of the candle wont help. You need to condense the chart to be able to work better.
In NetDania.com charts this is done via the menu item View >> Periods, and set this to 1000.
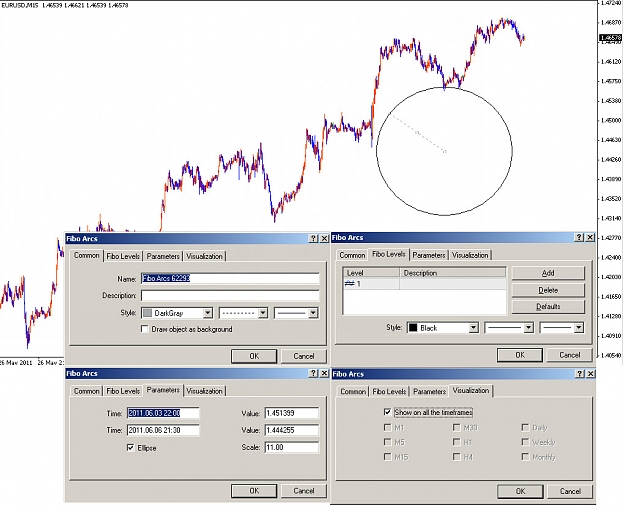
Drawing Circles On MetaTrader 4
In metatrader you cannot draw the circles with as much ease that you can in NetDania's Chart station. You have to modify either the Ellipse Tool or the Fibonacci Circle Tool in MT4 to draw the circles. A diagram is shown below on how to modify the fibonacci circle tool. Please scroll down to find it.
The main problem in Metatrader 4 is that if you switch time frames your circle changes shape and becomes elliptical, so it will work on only one time frame and wont work on others.
Adjusting Window Size
You need to make sure that for all practical purposes the width and height of the window where you are drawing the circles is equal, otherwise you might get slightly off price levels for your calculation when drawing the circles. If the resoloution of your desktop is 1024x768, then your charts will be a bit wider, and you need to make the window size where price action is occuring a square size, so you get proper aspect relationship for the diameter and circumference of the circle you are drawing.
Areas Of Circle
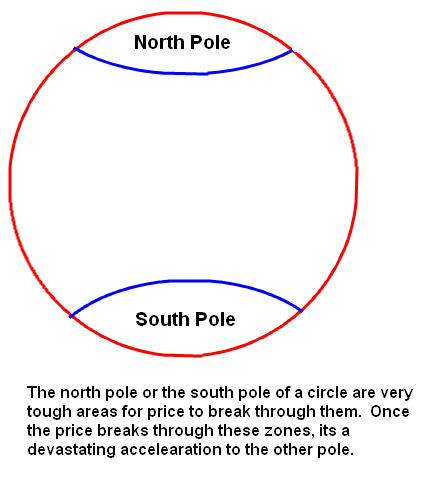
Strong Points
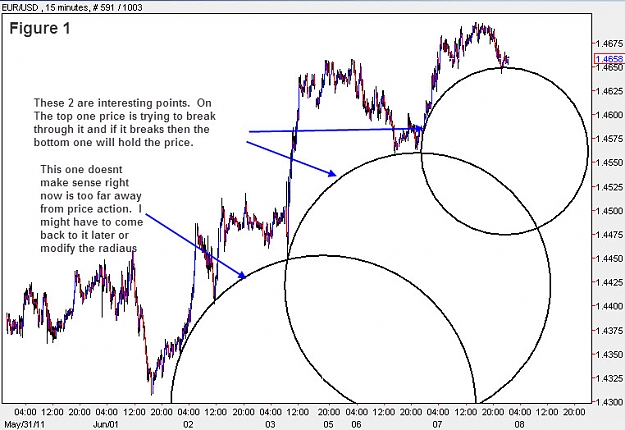
There are 2 strong points on a circle which is tough for price to break THROUGH or break OUT from, these are the 2 poles, north and south as shown in the diagram.
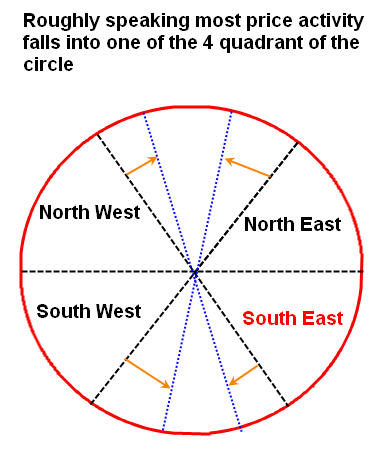
Activity Points
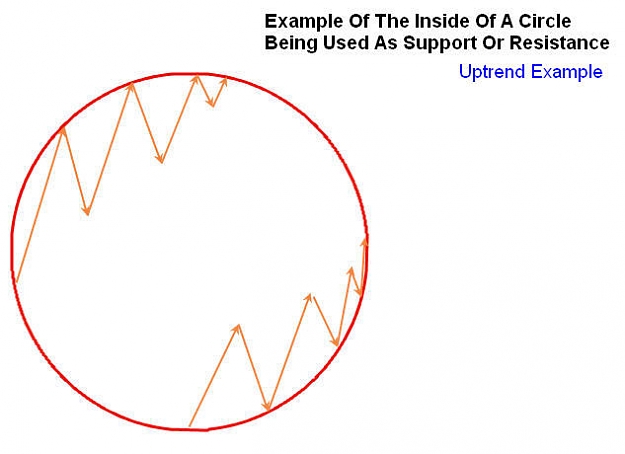
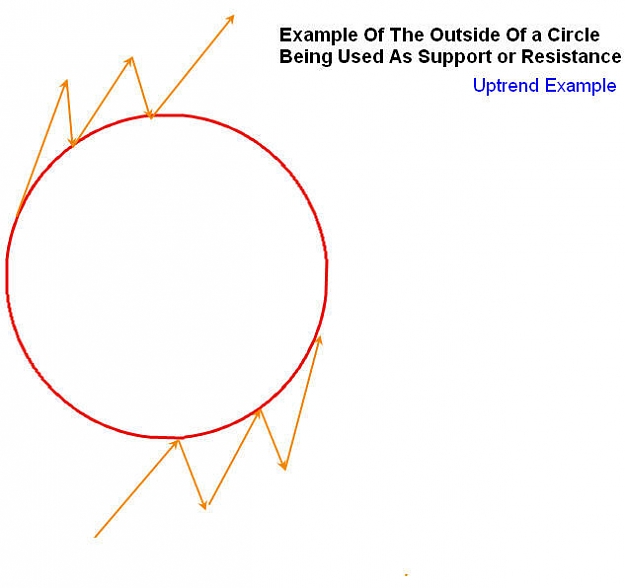
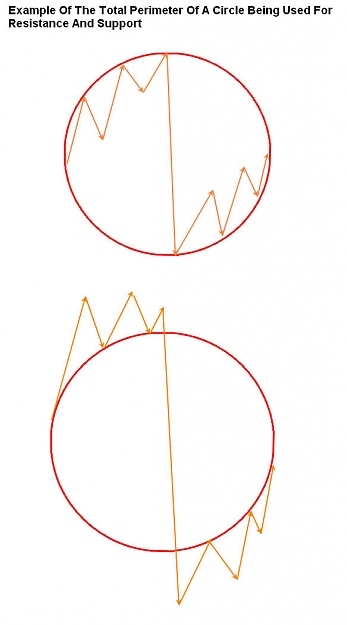
Price is active most of the time in one of the 4 quadrant of the circle as shown. These quadrant are NW, NE, SW, and SE. It can be active inside or outside of the perimeter within one of the zones above. Price can be active inside a circle (Inside Circle) or active within the perimeter of a circle (Outside Circle)
Strength
A circle has 2 kinds of strength
1. Outside Strength
The strength of this type is measured by how many points are on that circle, if these points lie on the inside of the circle, it makes the inside stronger, if they line up on the outside, then it makes the outside stronger. If a motion breaks such a tough circle, it would not be allowed to go back to its previous state very easily. For example if motion adhers to the outside of a circle and then penetrates it and moves to the inside, then it would be very difficult to get back to the outside soon. Price has to spend a considerable amount of time inside the same circle to go higher or lower (depending on trend), so that it can find another point on the same circle to switch directions.
2. Inside Strength
This is not that obvious at the beginning, but the center of the circle as well as the whole circle as a entity in itself can be a very strong area on the chart where motion will find strong reactions. Price Action can find great confrontation when it approaches the center of a circle. If you are familiar with Elliot Wave, these type of confrontations ususally cause a reversal to happen towards the center of the circle and are called "Corrective Moves" in Elliot Wave terminology. Then there is the case where Price Action will speed up tremendously as it approaches the center of the circle and this happens in the type of moves that are labelled as "Impulse Moves" in Elliot Wave terminology.
Then we come to the whole circle itself which can be treated as a entity within a certain area of a chart, where the energy of this entity is so strong that will repel and bounce motions off it with considerable strength. Out of my personal experiences, these circles are smaller but with more powerfull repelent action. It also looks like they emit a kind of energy or for a lack of a better word, an aura, of themselves that affects the shape of the movement that passes by them. After a while of circle drawing you will notice such areas and they help a lot in fine tunning your analysis, but they are the most difficult of zones to find out and as time passes they will show themselves more and more.
Direction
Price always tries to go from the inside of the perimeter of a circle to its outside and from outside to inside. If it cant do that on a strong circle it will find the path of least resistance to attempt the same thing on a different circle, until it reaches a circle where it cant play the same game anymore, and it will react in the opposite direction. The circles with more strength will push price to bounce off them and go to circles with less strength until a circle with equivalent or more strength is reached where a reaction occurs. Knowing the strength of circle is a very important point to consider when trying to find direction. Which circle is the stronger, which one is the weaker one, and where is the next stronger circle.
Zones
When several circles intersect in the same area, it makes that area very important
Empty Space
When there is a empty space between 2 circles, with no other major circles in between, then price will rush through such zones.
Center Of A Circle
If a motion starts from the perimeter of a circle and moves inwards towards the center of that circle, 2 things will happen:
1. It will either find a tough resistance to penetrate through the center, this happens in the case of corrective motions, or
2. It will speed up in acceleration as it approaches the center, and it will land on the other side of the perimeter.
Method Of Analysis
1. Use your circle tool to draw a circle
2. Move the circle around your chart trying to align as many points as you can on it. Play around with the diameter to get a good curve.
3. Draw several circles on different areas of the chart.
4. Find out which ones are the stronger ones and which ones are the weaker ones. Pay attention to how price bounces off them, and how price moves towards the center of the circle
5. Note any empty space in between.
6. As the price moves, draw more circles around the movement, either using 2 points or 3 points or more, pay attention to how the angle of the decent/ascend moves along with the bubbles. When things speed up the bubles around a path tend to change angles close to 90 degrees, and the initial bubbles that you draw provide support for the later ones. and as motion wants to switch direction the bubbles will eventually shift to a angle around 20-30 degrees.
7. If you can find 2 points draw a circle and see whether price moves to the perimeter of it, creating a third point. If it does then a rebound might occur making the perimeter of that circle a great place to buy/sell.
8. Pay attention to how several circles sqeeze price and other ones create a area of expansion. A squeeze of price is the momentum that it needs to accelerate when it finds an area of expansion.
9. Do the above on all time frames.
10. Higher time frame circles are more important than lower time frame.
11. Use the lower time frame circles to find a good entry once you have a story to tell using the circles.
12. When a reaction happens, see whether the reaction is still finding support/resistance on the previous bubbles or not. How is it breaking them?
Take Profit
A bounce from once circle can land on a number of other circles. Ususally the first one should be used as take profit. Depending on the time frame you are trading, this first circle would be 10 pips away on M1 or 100 pips away on M15
Stoploss
Usually you need more than 1 circle to find stoploss. If motion is going in a Inside Circle pattern, then you need to have a Outside Circle along a common series of points with the inside circle to find stoploss. The stoploss would fall within the perimeter of the Outside Circle. You have to experiment with this to find the proper stoploss. You dont want to get caught in the trap of the perimeter of one circle breaking, then landing on a different circle and then going in the same direction as the original move.
Word Of Caution
Working with circles is not easy and takes time to get a feel of what the circles are telling you. If you use indicators along with circles, there is high probability that you will get confusing signals, specially if you use more than one. Anything a circle tells you is only relative to the time frame that you are trading. Circles only give you a possible limit of a move and direction, but as the move starts a lot of other thing can happen, so thinking again that the move has to reach your target is not a wise idea, because it can decide not to go the way you think and choose a different path but still manage to reach what you thought. If you have to use a indicator, then only use one, such as the RSI. The best indicator that you can use is a pair of good eyes.
Additional Posts To Check
On Configuring NetDania:
http://www.forexfactory.com/showthre...81#post4679881
On Drawing Circles:
http://www.forexfactory.com/showthre...72#post4705372
On Steps To Take To Draw Circles (A Quick Guide):
http://www.forexfactory.com/showthre...73#post4721073
Examples Of Circle Drawing Methods Explained:
http://www.forexfactory.com/showthre...02#post5038202
http://www.forexfactory.com/showthre...80#post5038280
On How To Tell Direction Using Circular Trendlines:
http://www.forexfactory.com/showthre...40#post4726240
On Powerfull Smaller Circles (Energy Circles) Where Price Is Defended Very Strongly:
http://www.forexfactory.com/showthre...76#post4767176
http://www.forexfactory.com/showthre...=1#post4729515
http://www.forexfactory.com/showthre...58#post5078858
http://www.forexfactory.com/showthre...58#post5109458
http://www.forexfactory.com/showthre...90#post5181890
On Drawing Circles On Indicators Such As RSI:
http://www.forexfactory.com/showthre...68#post4749868
On Using Circles To Gage Relative Strength of A Point On A Straight Trendline:
http://www.forexfactory.com/showthre...53#post4898153
An Example Of Multiple Circles On A Chart Pointing To The Same Overall Theme:
http://www.forexfactory.com/showthre...=1#post4916735
On What To Look For When Choosing A Position (Have to read few more posts after each link)
http://www.forexfactory.com/showthre...37#post4991737
http://www.forexfactory.com/showthre...88#post5189188
On What To Do To Avoid Bad Trades And Eventually Turn Them Into Good Trades:
http://www.forexfactory.com/showthre...52#post5051552
On Circle Drawing Techniques:
http://www.forexfactory.com/showthre...02#post5038202
http://www.forexfactory.com/showthre...80#post5038280
http://www.forexfactory.com/showthre...94#post5061494
http://www.forexfactory.com/showthre...03#post5061603
http://www.forexfactory.com/showthre...16#post5090716
New Rule: http://www.forexfactory.com/showthre...78#post5165078
http://www.forexfactory.com/showthre...72#post5181972
On Other Trendline Techniques:
http://www.forexfactory.com/showthre...05#post5342105
On How To Find The Junction Of Time And Price:
http://www.forexfactory.com/showthre...20#post5595120
http://www.forexfactory.com/showthre...29#post5613129
http://www.forexfactory.com/showthre...95#post5674795
On Median Line Analysis And Acceleration Of Price:
http://www.forexfactory.com/showthre...37#post5868037
Best of Luck
Happy Trading
Kambooj
Attached Image(s) (click to enlarge)
Attached Images