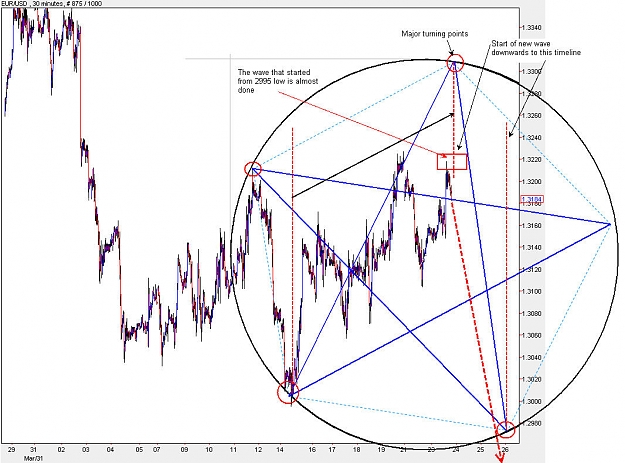
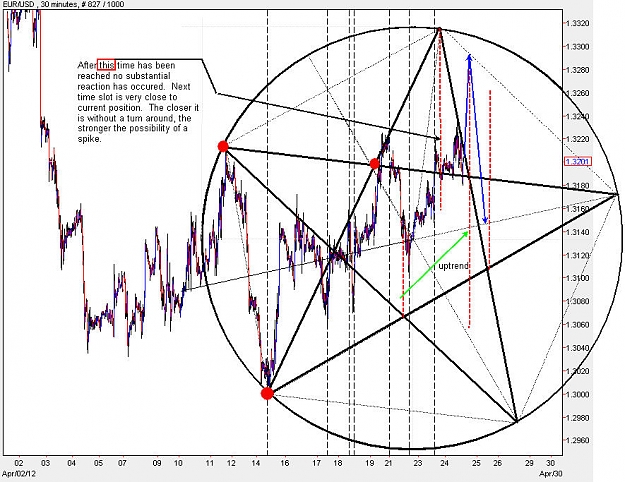
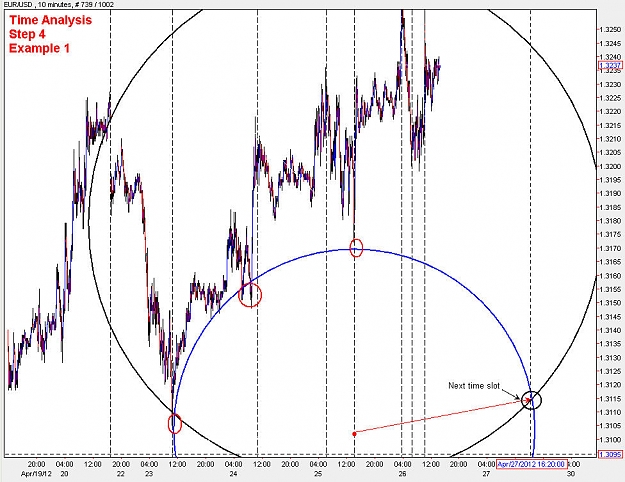
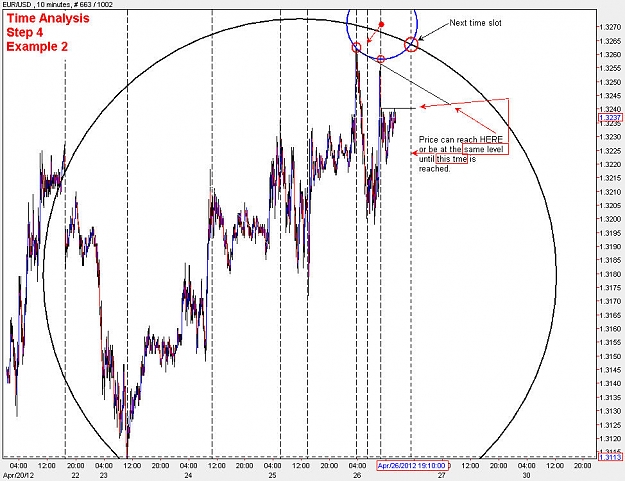
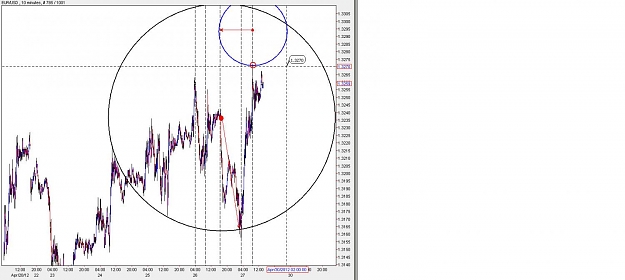
Since there is no tool on the chart to really see beyond the right most limit, I try to draw the same picture again few hours later, to see whether I have come close the time line.
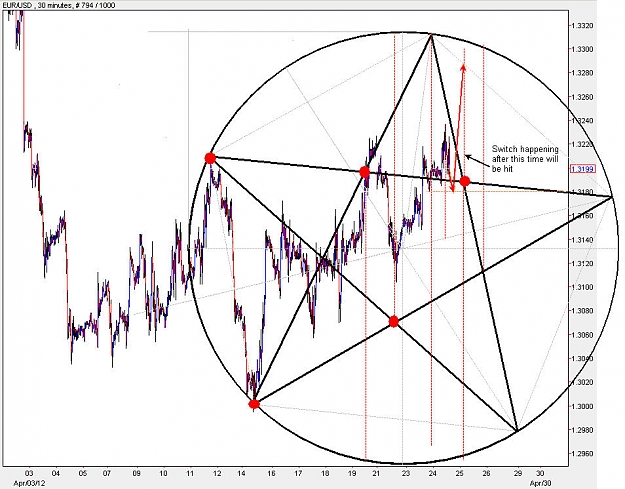
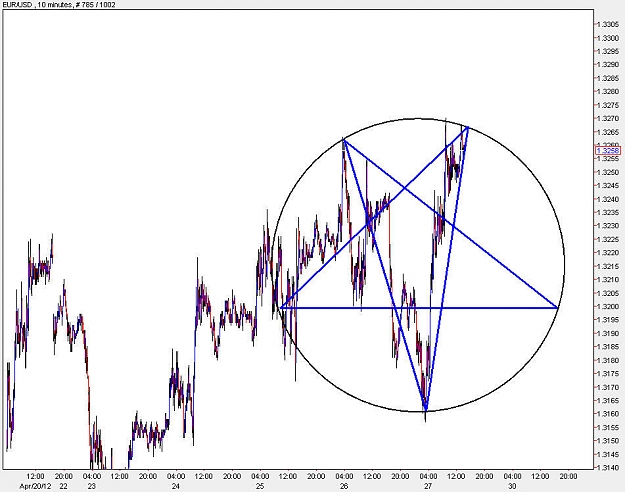
As far as drawing the stars, havent found any tools yet, so I take snapshots, of the screen, go to MS Word and use the pentagon tool over there, then fit everything to the circle, and cut and paste into "Snagit" and edit the stuff over there.
Quite cumbersome, but thats the only way I know to do, for the hexagon I use Fibonacci line analyzer software, but the pentagon, I do manually
DislikedKambooj,
How are do you determine where the time lines are and how are you drawing your star shapes (trendlines ?)
ThanksIgnored
Attached Image (click to enlarge)