Hi guys,
Just a quick post as I'm really busy at work today (will try and post some charts when I get home tonight).
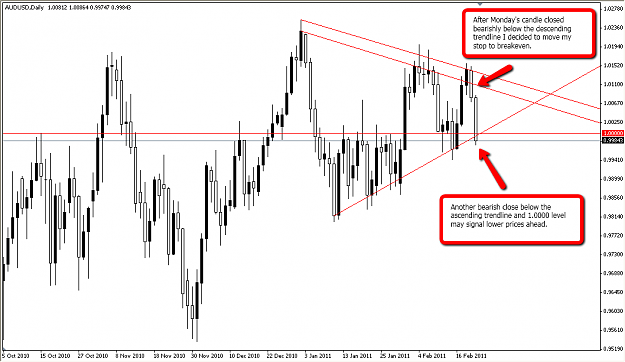
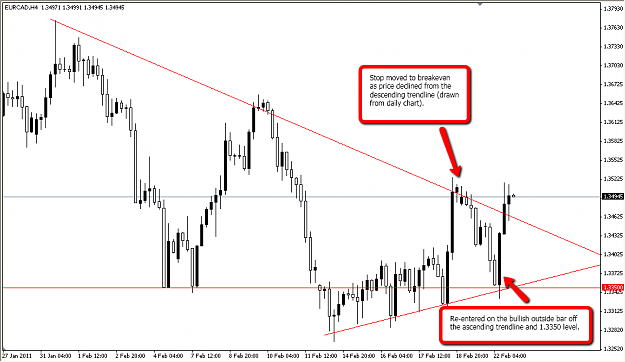
My AUD/USD and EUR/CAD trades both closed out at breakeven. I have since re-entered EUR/CAD and watching price action on AUD/USD to determine whether or not I get back in.
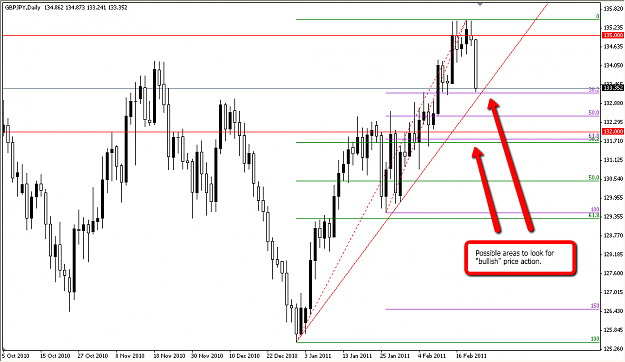
My GBP/USD and EUR/USD trades are still open.
Regards,
Dan
Just a quick post as I'm really busy at work today (will try and post some charts when I get home tonight).
My AUD/USD and EUR/CAD trades both closed out at breakeven. I have since re-entered EUR/CAD and watching price action on AUD/USD to determine whether or not I get back in.
My GBP/USD and EUR/USD trades are still open.
Regards,
Dan