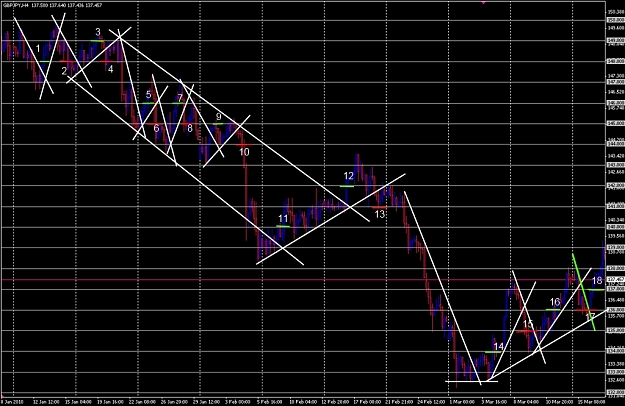
As a quick update if price had pushed slightly higher between my entries at 6 & 7 (around the 17th Feb), I would probably look to diversify here due to the reason that the main trend looked like it was changing from down to up.
Thegman's Journal (Equity Millipede Concept) 102 replies
Trading an Equity Millipede 23 replies
Equity millipede & Flying Buddha trading journal 9 replies
Build an Equity Millipede with the filtered Flying Buddha 171 replies
Application Development - Journal of Building an equity millipede 14 replies
DislikedGame rules
All you need to do is choose 8 random numbers. Must be 'random'
Add the pips together and please post a reply in the thread.
Please note you could be unlucky at picking the random numbers and still have a loss at the end. Please consider this as close to real life but the worst case scenario. Almost pure random with completely no control.Ignored
Dislikedhi graeme,
this is my chart, please make advise to it
reason i took a diversification because after ranging period, there is suddenly movement of price almost 400 pips, i feel there is something happen in next price
regards,
hariIgnored
DislikedHi Graeme,
Here is my take on the second chart.
All short entries are in magenta and all long entries are in green. Two lots entered at each position, +100 assumes 1 lot taken out at 1:1 and second lot taken out at BE. -200 both lots taken out at hard SL of -100. As I see it only entries A, B and C survive to what becomes the bottom of the down trend at 132.300. I know that price retraces to entry point A but I would have held this position based on the fact that I recognized the up wave as an Elliott wave 4th wave. So in this case I cheated...Ignored
DislikedHi Graeme
This is conservative approach using nothing but the 4 hour time frame for EP. You will note I have a thing for ema's still, I like to play power pivot and pinbar EP's off ema's. I realise that they are lagging indicators but I feel they hold some worth.
In reality I would be looking for better EP's on the hourly.
Cheers
MarkIgnored
DislikedHere are my reasons for entering trades:
1. Price bounced off Support and broke thru mini-resistance - Go LONG
2. Large Range bar from Resistance - Go SHORT
3. Large Range bar - Break down from Support - Go SHORT
4. Large Range bar - Break down from Support - Go SHORT
5. Price in Mini-Range (suggests change of trend) followed by Breakout
from Resistance - Go LONG
6. Narrow Range - Breakout from Resistance - Go LONG
7. *Risky Trade* Downbar with long downward wick hitting uptrend support
followed by upbar - Go LONG
8. Breakdown thru support (triangle...Ignored
DislikedHello Graeme,
Here's my homework. For a volatile pair like gpb/jpy I will use breakout near the .000 level. From your chart I have 8 short and 7 long. If stop loss at the .000 mark all the shorts are still alive. 5 longs stopped out and 2 long still surviving.
Total pips for short 4,394 less approx 500 pips stopped out equals to 3,894. This excludes the floating profit of 200 pips from long which is still alive.
For diversification I would probably clear s7,s8,b6 and b7 if the price breach 142.
For your comments "Sifu"
Thank you once again.
chonghm...Ignored
DislikedHello Graeme,
Apologies as this is slightly off-topic from the current discussion but would it be possible at some point later on in this thread to discuss how you manage all these positions. Using the last chart as an example (which is only a couple of months), most posters would have a total of 10-20 trades.
For me, keeping track of all those positions and being able to initially group them and then move them from one group to another (especially as the majority would be held for much longer) could become quite difficult.
Consequently,...Ignored
DislikedA bit late to the game:
I chose 2 4 5 7 8 9 11 13, specifically ignoring 1. Resulting in a loss of -100!
MinkaIgnored
DislikedHave based my trades on T/L breaks this time instead of S/R breaks.
Feels harder to set the T/L's when bigger moves have occurred.
Was quite surprised as thought it would have been easier to produce entries.
20 trades over all for the 10Jan - 17Mar period.
At the RH edge of the chart @ about 138.70 had 3 buys remaining and 6 sells, based on the 2 parts/trade, 1 @+100 hard TP, both @-100 hard S/L.
Didnt count on moving the S/L to BE, cause other +100 part was expected (that word again) to TP.
Actually ended up with only 2 that didnt, so they were...Ignored