I did the same too.
First generate a number between 0 and 1 for Up- and Downbars next
a number between 1 and 52 (the Pipsdistance) which will be added or substracted from the starting price depending on type of bar.
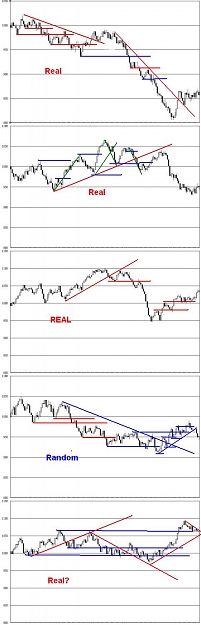
The result looks excatly like a real chart you could draw trendlines or count Elliot Waves. But there is a underlying structure in all financial markets which I have been able to quantify (which proved that Fibnumbers are Bullshit). If you do the same test with a random chart and a real one it sticks right out.
That's all I have to say. I will not go into detail here because I'm afraid it will lead nowhere when discussed in an open forum because of its complexity.
You can also load Temperature Data into MT4 and get funny looking charts with Pinbars.
First generate a number between 0 and 1 for Up- and Downbars next
a number between 1 and 52 (the Pipsdistance) which will be added or substracted from the starting price depending on type of bar.
The result looks excatly like a real chart you could draw trendlines or count Elliot Waves. But there is a underlying structure in all financial markets which I have been able to quantify (which proved that Fibnumbers are Bullshit). If you do the same test with a random chart and a real one it sticks right out.
That's all I have to say. I will not go into detail here because I'm afraid it will lead nowhere when discussed in an open forum because of its complexity.
You can also load Temperature Data into MT4 and get funny looking charts with Pinbars.