I would like to share with You some interesting idea I once developed myself and still using very often.
Try to take a look on a chart without any additional indicator - just pure candlesticks.
Probably it is hard even for experienced traders to tell what actually will happen in the future when seeing only the bars.
But let's take this more simple!. Looking on a chart. Are You able to guess which strategy worked best during the period You are looking at?
Starting from point A and finishing at B.
What was the best strategy to trade?
First take a look on a chart like this one
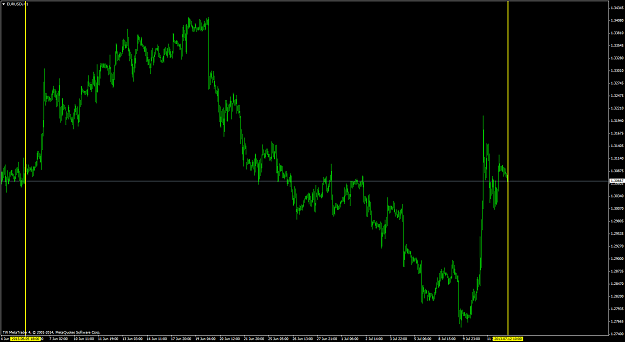
it is about 640 bars on EURUSD H1 chart.
To not to think too much let's try to pick 1 of 3 predefined simple strategies without any MM:
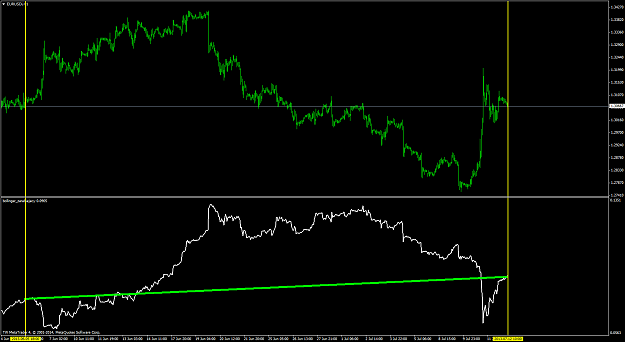
1. Bollinger band [15,1] - trades are taken around the BB (short when above, long when below)
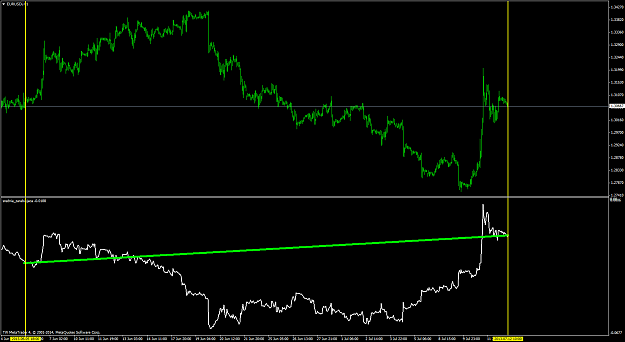
2. Moving average [25, close] - long trades are taken when close above MA, short are taken when close below MA
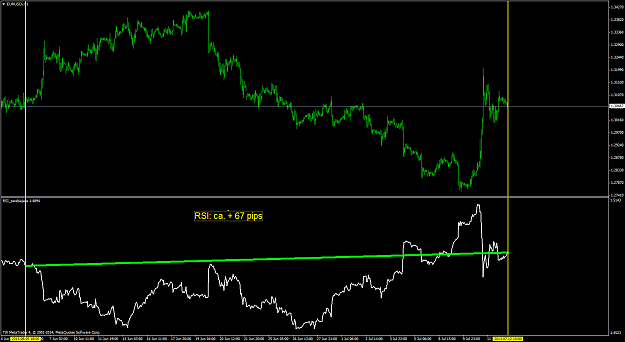
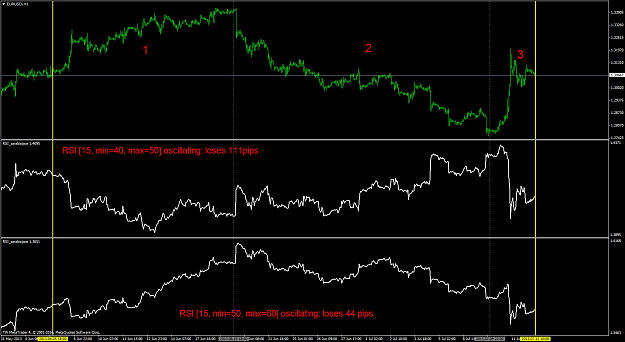
3. RSI [15] - trades are taken around RSI 45 and 55. When last RSI closed below 45 go long, when last closed above 55 go short
Only those 3 for a beginning.
I'll show You how to simply have a nice insight into this without programming each EA and backtesting it in strategy tester.
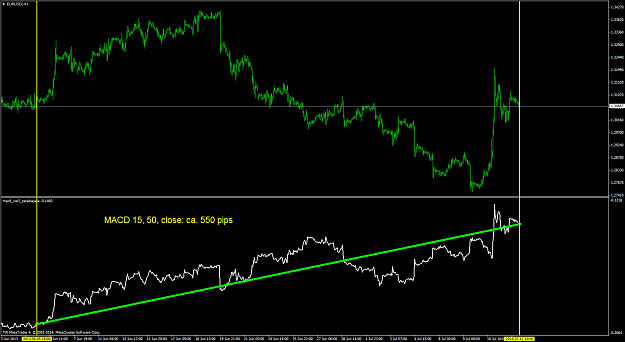
The tool I would like to share with You has even greater power in some aspects, as it gives to a trader kind of a function F(x) in which F() is a general accumulative profitability of a strategy and x variable is the candle bars.
In my next post I'll show You what exactly is this tool.
Hope You will find it interesting as much as I did.
I'll appreciate Your opinions.
Regards!
Marek
Try to take a look on a chart without any additional indicator - just pure candlesticks.
Probably it is hard even for experienced traders to tell what actually will happen in the future when seeing only the bars.
But let's take this more simple!. Looking on a chart. Are You able to guess which strategy worked best during the period You are looking at?
Starting from point A and finishing at B.
What was the best strategy to trade?
First take a look on a chart like this one
Attached Image (click to enlarge)
it is about 640 bars on EURUSD H1 chart.
To not to think too much let's try to pick 1 of 3 predefined simple strategies without any MM:
1. Bollinger band [15,1] - trades are taken around the BB (short when above, long when below)
2. Moving average [25, close] - long trades are taken when close above MA, short are taken when close below MA
3. RSI [15] - trades are taken around RSI 45 and 55. When last RSI closed below 45 go long, when last closed above 55 go short
Only those 3 for a beginning.
I'll show You how to simply have a nice insight into this without programming each EA and backtesting it in strategy tester.
The tool I would like to share with You has even greater power in some aspects, as it gives to a trader kind of a function F(x) in which F() is a general accumulative profitability of a strategy and x variable is the candle bars.
In my next post I'll show You what exactly is this tool.
Hope You will find it interesting as much as I did.
I'll appreciate Your opinions.
Regards!
Marek
Attached File(s)