Bah, its a closed case but I'll throw some thoughst in...
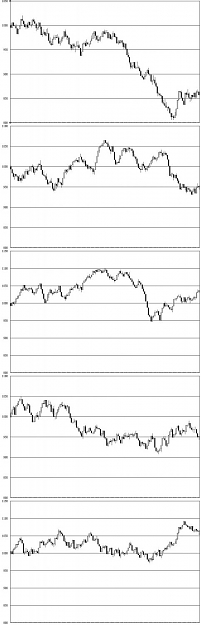
You can distinguish it by the limitations on random behavior imposed. All your bars will be a random distribution between 0 and 51 pips in length. That alone is enough to pick out a random chart. Real markets exhibit long tail behavior in maximum price movement. For example 95% of the bars may be <51 pips. 97% will be below 75 pips, 99% will be below 100 pips and 100% will be <~250pips.
Another key point is time sequencing. In the short time frames, real data will exhibit recurring sequences of price volitility that correlate to prime market hours. IE - 8am to 2pm est will be volatile while 4pm - 7pm will be relatively stable.
On longer time frames, real data tends to trend more due to the impact of marcoeconomic fundamental factors.
Finally, the number of samples will dramatically impact ones ability to notice these discrepencies. Any random 100 bar sequences would be fundamentally indistinguishable from real data. Once you get out to 1000 bars, it's almost impossible NOT to notice the differences.
PS - Hank, thats an awesome forum name you have there.