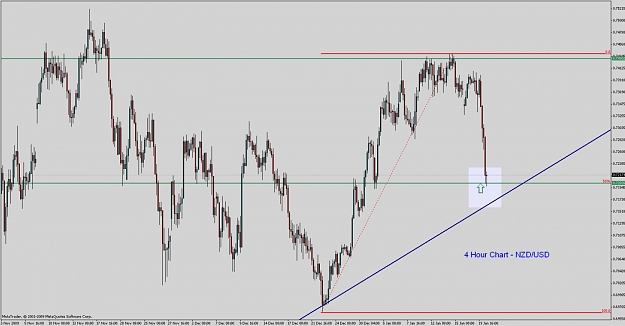
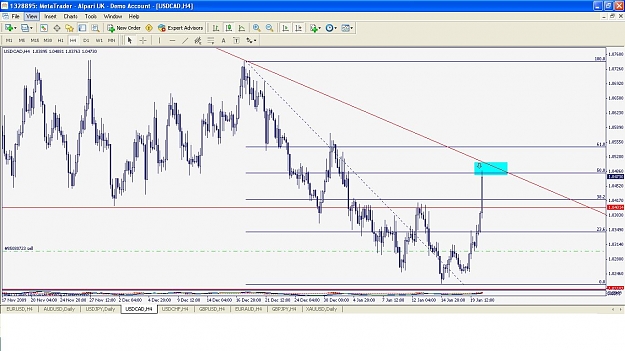
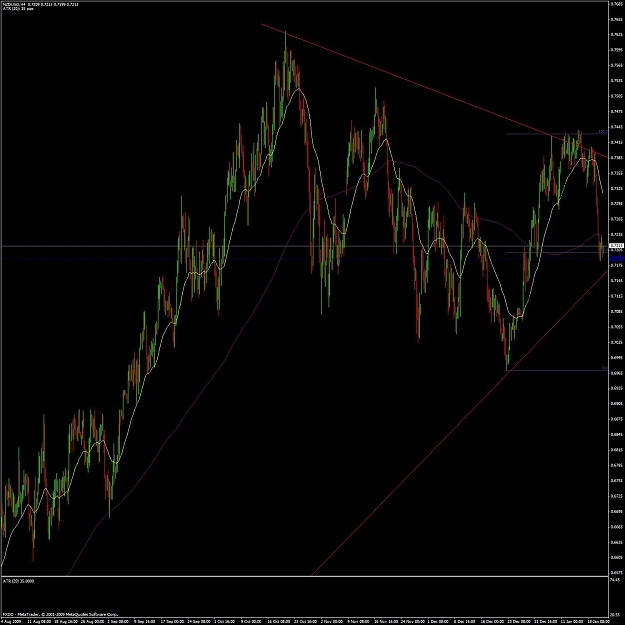
Just skimming my way through the 4 hour charts and came across one that looks a neat area for entering long. 50% retrace from the latest move up and round number at 0.7200, historical data shows reactions around this number, could be worth watching this one.
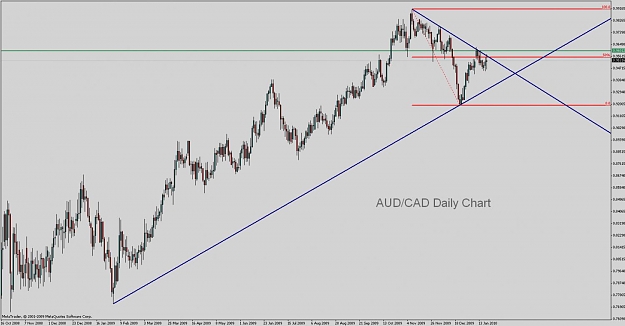
The TL you see is just a subjective one and was taken from 9th March 2009 to the most recent low 22nd Dec 2009 using a daily chart.
The TL you see is just a subjective one and was taken from 9th March 2009 to the most recent low 22nd Dec 2009 using a daily chart.
Attached Image (click to enlarge)