• Home
  • Forums
  • Trades
  • News
  • Calendar
  • Market
  • Brokers
  • Login
  • Join
  • User/Email: Password:
  • 5:42am
Menu
  • Forums
  • Trades
  • News
  • Calendar
  • Market
  • Brokers
  • Login
  • Join
  • 5:42am
Sister Sites
  • Metals Mine
  • Energy EXCH
  • Crypto Craft

Options

Bookmark Thread

First Page First Unread Last Page Last Post

Print Thread

Similar Threads

Are you a trend trader or a counter-trend trader? 29 replies

Trading bounces off daily chart trend lines 13 replies

Trend trading with 55EMAs on the Daily Chart 10 replies

Is Grid Trading (combined trend following and counter trend) Profitable? 3 replies

Using trend on 1hr chart for trading on 15m chart 0 replies

  • Interactive Trading
  • /
  • Reply to Thread
  • Subscribe
  • 583
Attachments: Trend Trading Chart Thread
Exit Attachments
Tags: Trend Trading Chart Thread
Cancel

Trend Trading Chart Thread

  • Last Post
  •  
  • 1 3536Page 373839 107
  • 1 Page 37 107
  •  
  • Post #721
  • Quote
  • Jan 20, 2010 9:50am Jan 20, 2010 9:50am
  •  Xj8
  • | Joined Sep 2009 | Status: Member | 130 Posts
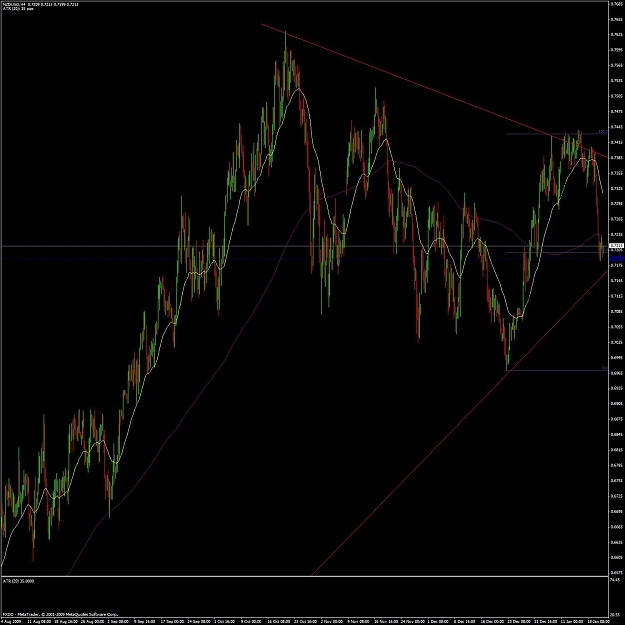
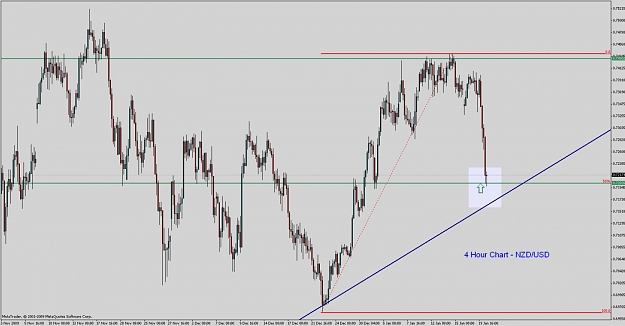
Just skimming my way through the 4 hour charts and came across one that looks a neat area for entering long. 50% retrace from the latest move up and round number at 0.7200, historical data shows reactions around this number, could be worth watching this one.

The TL you see is just a subjective one and was taken from 9th March 2009 to the most recent low 22nd Dec 2009 using a daily chart.
Attached Image (click to enlarge)
Click to Enlarge

Name: 20th jan nzdusd 4hr.jpg
Size: 96 KB
 
 
  • Post #722
  • Quote
  • Jan 20, 2010 10:03am Jan 20, 2010 10:03am
  •  bez3000
  • | Joined Feb 2009 | Status: Trading Made Simple K.I.S.S | 762 Posts
Dan, coolshades and anyone who would like to give an opinion are welcome to comment.
I have attached some of my charts and marked areas i think could be of interest with blue boxes, if price makes these areas and is rejected i think may be worth trading.
All comments are welcome.
Attached Image(s) (click to enlarge)
Click to Enlarge

Name: eurusd.JPG
Size: 114 KB
Click to Enlarge

Name: audusd.JPG
Size: 117 KB
Click to Enlarge

Name: euraud.JPG
Size: 121 KB
Click to Enlarge

Name: usdcad.JPG
Size: 135 KB
 
 
  • Post #723
  • Quote
  • Jan 20, 2010 10:07am Jan 20, 2010 10:07am
  •  coolshades
  • | Joined Nov 2006 | Status: very junior member | 1,576 Posts
coincidentally was looking at the bleeding same! current price also acted as a strong support around 4th jan.

Quoting Xj8
Disliked
Just skimming my way through the 4 hour charts and came across one that looks a neat area for entering long. 50% retrace from the latest move up and round number at 0.7200, historical data shows reactions around this number, could be worth watching this one.

The TL you see is just a subjective one and was taken from 9th March 2009 to the most recent low 22nd Dec 2009 using a daily chart.
Ignored
 
 
  • Post #724
  • Quote
  • Jan 20, 2010 10:13am Jan 20, 2010 10:13am
  •  Xj8
  • | Joined Sep 2009 | Status: Member | 130 Posts
This is another area of interest, although I see nothing other than a weakish support area, price tends not to close below 128.8 but has pushed considerably further, I can't place any decent fib there that would support a buy here. I would expect 127.0 as the next target area for a probable buy, just another area to keep our eyes on. The only problem I have here is, yet again the lack of a 50% fib for support.

I'm just thinking aloud here, feel free to chip in your reasons to buy or not.
Attached Image(s) (click to enlarge)
Click to Enlarge

Name: 20th jan eurjpy daily.jpg
Size: 101 KB
Click to Enlarge

Name: 20th jan eurjpy 4hr.jpg
Size: 97 KB
 
 
  • Post #725
  • Quote
  • Jan 20, 2010 10:13am Jan 20, 2010 10:13am
  •  castlerock
  • | Joined Sep 2009 | Status: Member | 108 Posts
Quoting Xj8
Disliked
Just skimming my way through the 4 hour charts and came across one that looks a neat area for entering long. 50% retrace from the latest move up and round number at 0.7200, historical data shows reactions around this number, could be worth watching this one.

The TL you see is just a subjective one and was taken from 9th March 2009 to the most recent low 22nd Dec 2009 using a daily chart.
Ignored
Thats a strong bearish move going on look's like it's heading down to the 0.7050 area.
 
 
  • Post #726
  • Quote
  • Jan 20, 2010 10:29am Jan 20, 2010 10:29am
  •  Xj8
  • | Joined Sep 2009 | Status: Member | 130 Posts
My thoughts on this pair tend to favour a sell in the 1.0450/80 area, my last two posts gave areas with no possitive areas for a trade, this pair looks a stronger probability. We have a nice inner daily trendline along with a round number close to the 50% fib retrace. I'll be looking to see just how much resistance this tends to give before committing any hard cash in a bid to sell.
Attached Image(s) (click to enlarge)
Click to Enlarge

Name: 20th jan usdchf daily.jpg
Size: 90 KB
Click to Enlarge

Name: 20th jan usdchf 4 hour chart.jpg
Size: 94 KB
 
 
  • Post #727
  • Quote
  • Jan 20, 2010 10:34am Jan 20, 2010 10:34am
  •  Xj8
  • | Joined Sep 2009 | Status: Member | 130 Posts
Quoting castlerock
Disliked
Thats a strong bearish move going on look's like it's heading down to the 0.7050 area.
Ignored
Always a possibility, if the TL fails to hold, then I would expect it to make its way back down to the next support level at 0.7000 to 0.7050.
 
 
  • Post #728
  • Quote
  • Jan 20, 2010 10:35am Jan 20, 2010 10:35am
  •  coolshades
  • | Joined Nov 2006 | Status: very junior member | 1,576 Posts
watching same pair and price/place.

i did have a long on this from 0250 ish which i closed for 100 pts, but that was off a different system.

Quoting Xj8
Disliked
My thoughts on this pair tend to favour a sell in the 1.0450/80 area, my last two posts gave areas with no possitive areas for a trade, this pair looks a stronger probability. We have a nice inner daily trendline along with a round number close to the 50% fib retrace. I'll be looking to see just how much resistance this tends to give before committing any hard cash in a bid to sell.
Ignored
 
 
  • Post #729
  • Quote
  • Jan 20, 2010 11:22am Jan 20, 2010 11:22am
  •  vicky_ag
  • | Joined Feb 2009 | Status: Member | 295 Posts
Quoting DanUK
Disliked
Hi Vicky,

I think the 93.00 area was a good place to look for a sell entry so I agree with your direction/trade bias.

I don't really look to the weekly chart for trades so I am not qualified to suggest too much but I don't see why you couldn't trade this method on the weekly - it will just be a lot slower (not a bad thing) and you will need a bigger stop size.

I also am not a position scaler - I'm sure it can be done with some effect but for me it's too complicated! I like to keep things simple!

Have you tried trading the daily timeframe?...
Ignored
Dan , I just found your thread abt a day or two ago while skimming through Jacko's thread. I havent tried trading this on daily. I will try for sure if I can find a setup which looks gud.

BTW, while looking at trades on daily should we include the confluence of the fibs (50%) with the TL ?? Or are we looking at just TLs to trade off?
 
 
  • Post #730
  • Quote
  • Jan 20, 2010 11:29am Jan 20, 2010 11:29am
  •  Xj8
  • | Joined Sep 2009 | Status: Member | 130 Posts
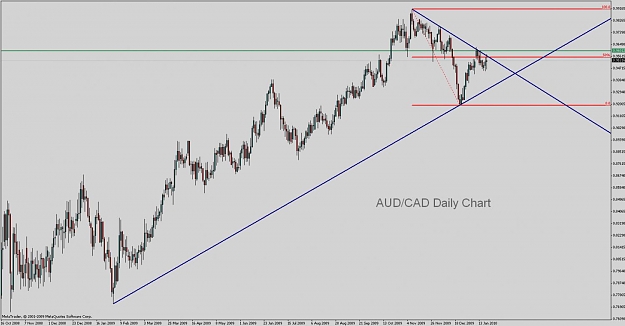
I would ideally be looking for a buy, but there seems an opportunity to sell to the lower TL, not that I'm going to, just looked a reasonable place for a quick sell.
Attached Image (click to enlarge)
Click to Enlarge

Name: 20th jan audcad daily chart.jpg
Size: 88 KB
 
 
  • Post #731
  • Quote
  • Jan 20, 2010 11:34am Jan 20, 2010 11:34am
  •  Bankshot
  • | Joined Nov 2009 | Status: Member | 333 Posts
bez3000
I think your charts are accurate if (and I don't know enough to comment) we are not still in continuation of measured moves(dn/up). There should be a bounce point somewhere, is it here?
 
 
  • Post #732
  • Quote
  • Jan 20, 2010 11:47am Jan 20, 2010 11:47am
  •  jcalow
  • | Joined May 2006 | Status: Determined Member | 99 Posts
Quoting jcalow
Disliked
Quite a bit of movement today, many of the pairs I watch have broken their TLs. Closed my previous order on this pair last night in the region of 149.00. Turned out to be a good plan. Waiting to see if this TL holds/what price action does for another buy.
Ignored
Had a busy day working and actually missed the entry on this one in the end. However, seems to be working out quite nicely.
 
 
  • Post #733
  • Quote
  • Jan 20, 2010 11:52am Jan 20, 2010 11:52am
  •  Brixton
  • | Joined Jun 2009 | Status: Member | 350 Posts
Quoting jcalow
Disliked
Quite a bit of movement today, many of the pairs I watch have broken their TLs. Closed my previous order on this pair last night in the region of 149.00. Turned out to be a good plan. Waiting to see if this TL holds/what price action does for another buy.
Ignored
Good work. I was also on this one today!
 
 
  • Post #734
  • Quote
  • Jan 20, 2010 2:28pm Jan 20, 2010 2:28pm
  •  coolshades
  • | Joined Nov 2006 | Status: very junior member | 1,576 Posts
could either of you put up a chart on this? cant see an entry on my h4 charts.

Quoting Brixton
Disliked
Good work. I was also on this one today!
Ignored
 
 
  • Post #735
  • Quote
  • Jan 20, 2010 5:00pm Jan 20, 2010 5:00pm
  •  coolshades
  • | Joined Nov 2006 | Status: very junior member | 1,576 Posts
am going long on this. beautiful bullish engulfing bear on h4, off the 50% fib on your chart.

Quoting Xj8
Disliked
Just skimming my way through the 4 hour charts and came across one that looks a neat area for entering long. 50% retrace from the latest move up and round number at 0.7200, historical data shows reactions around this number, could be worth watching this one.

The TL you see is just a subjective one and was taken from 9th March 2009 to the most recent low 22nd Dec 2009 using a daily chart.
Ignored
 
 
  • Post #736
  • Quote
  • Jan 20, 2010 5:30pm Jan 20, 2010 5:30pm
  •  jcalow
  • | Joined May 2006 | Status: Determined Member | 99 Posts
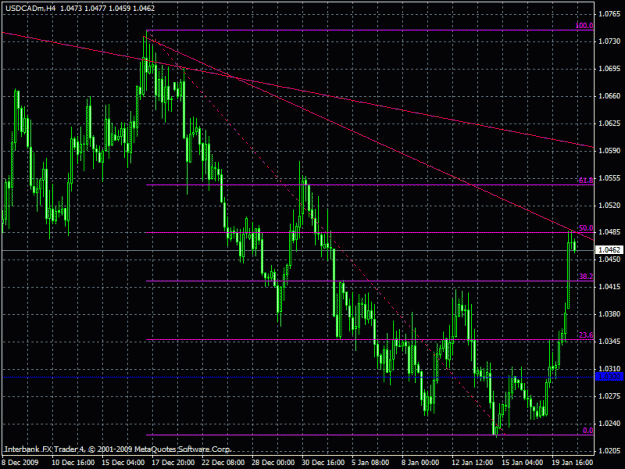
I'm looking at taking a short on USDCAD, subjective TL, but an exact two bar high off of the longer term 50% fib. Will see if the next 4hr bar closes short and then maybe go on a break of that or nearest round number.
Attached Image (click to enlarge)
Click to Enlarge

Name: chart.gif
Size: 28 KB
 
 
  • Post #737
  • Quote
  • Jan 20, 2010 5:35pm Jan 20, 2010 5:35pm
  •  jcalow
  • | Joined May 2006 | Status: Determined Member | 99 Posts
Quoting coolshades
Disliked
am going long on this. beautiful bullish engulfing bear on h4, off the 50% fib on your chart.
Ignored
Looks good, not quite a engulfing bar on my brokers charts yet, but the current one looks like it could end up being one.
 
 
  • Post #738
  • Quote
  • Jan 21, 2010 1:51am Jan 21, 2010 1:51am
  •  coolshades
  • | Joined Nov 2006 | Status: very junior member | 1,576 Posts
on my charts fxdd-mt4, its a very nice double bottom.

i am staying off usdcad, since i am exposed to $ now on two trades.

Quoting jcalow
Disliked
Looks good, not quite a engulfing bar on my brokers charts yet, but the current one looks like it could end up being one.
Ignored
Attached Image (click to enlarge)
Click to Enlarge

Name: nzdusd_buovb.jpg
Size: 162 KB
 
 
  • Post #739
  • Quote
  • Jan 21, 2010 6:17am Jan 21, 2010 6:17am
  •  coolshades
  • | Joined Nov 2006 | Status: very junior member | 1,576 Posts
not going so well, so wait and watch. am in a short on cable and gbpjpy so overall am comfortable.

Quoting coolshades
Disliked
on my charts fxdd-mt4, its a very nice double bottom.

i am staying off usdcad, since i am exposed to $ now on two trades.
Ignored
 
 
  • Post #740
  • Quote
  • Jan 21, 2010 9:30am Jan 21, 2010 9:30am
  •  jcalow
  • | Joined May 2006 | Status: Determined Member | 99 Posts
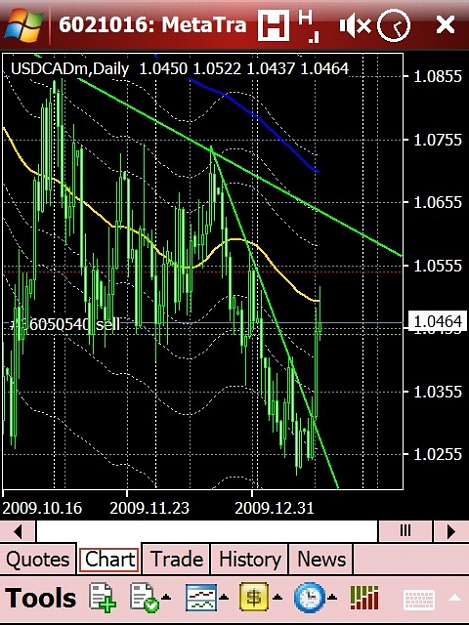
Not a lot of movement either way on my USDCAD trade. However the daily is forming a big pin bar, which is a good sign. Posted from my PDA as I am at university today.
Attached Image (click to enlarge)
Click to Enlarge

Name: psnap006.JPG
Size: 122 KB
 
 
  • Interactive Trading
  • /
  • Trend Trading Chart Thread
  • Reply to Thread
    • 1 3536Page 373839 107
    • 1 Page 37 107
0 traders viewing now
  • More
Top of Page
  • Facebook
  • Twitter
About FF
  • Mission
  • Products
  • User Guide
  • Media Kit
  • Blog
  • Contact
FF Products
  • Forums
  • Trades
  • Calendar
  • News
  • Market
  • Brokers
  • Trade Explorer
FF Website
  • Homepage
  • Search
  • Members
  • Report a Bug
Follow FF
  • Facebook
  • Twitter

FF Sister Sites:

  • Metals Mine
  • Energy EXCH
  • Crypto Craft

Forex Factory® is a brand of Fair Economy, Inc.

Terms of Service / ©2023